Introduction:
We have now covered what this solution does and its cost, at least from an ingestion standpoint. Now, we will finally be deploying something! In this article, we will generate our sample data, use it to create our new tables and DCRs, grant the appropriate permissions on those DCRs, and perform an initial ingestion!
For those familiar with my W365 collectors, Windows Endpoint collectors, or the learning series, this is effectively the same process. That said, I will provide the sample data this time.
In this section, we will cover…
- Requirements
- Zero: Complete the Requirements!
- 1: Sample Data
- 2: Table and DCR creation
- 3: DCR Permissions
- 4: Validating the Script
- 5: Let’s Upload some Data!
- 6: Validating Data Arrival
- 7. FAQ
- Conclusion
Requirements:
Before you can proceed with this article, you will need to have completed and deployed the following items from the learning series.
- Log Analytics Workspace and Data Collection Endpoint
You will need a DCE (Data Collection Endpoint) to hold the Data Collection Rules (DCRs) we are about to create. You will also need a Log Analytics Workspace to put the data into. Both the DCE and workspace are “generic” in the sense that you just need one of each to exist in the right region and preferably inside the same Resource Group as everything else that will be set up. That said, I would highly recommend you get a Log Analytics Workspace just for custom PowerShell-based logging like this to separate it from any agent-based logging you are doing. - Function App
You will need a setup Function App running the provided code. This is again a “generic” item in the sense that you just need one to exist in the right region and preferably inside the same Resource Group as your workspace. All (updated for new auth, including this series) collection scripts I make can use the same singular Function App and code that was deployed in the learning series V2.
Note: Completing the Function App section requires that you have a DCE setup first. Make sure you not only complete the deployment of the Function App but, also complete the permissions in the section named “Assigning the Function App Permissions.” - Creation and assignment of the policy outlined in the article Log Analytics for Application Usage Monitoring Part 1.3: Configure Event Auditing. This is needed for the events we query to even exist!
- Intune Proactive Remediation compliant licensing
- Visual Studio Code with the PowerShell Extension. You can use ISE if you must. For sample data, you may need to run it as either system or elevate the account that enrolled the device to local admin. Other admins besides the System account and the person who enrolled the device may not have the right permission to read all values the scripts need to work.
- I would recommend you get familiar with the creation of a DCR and deployment of proactive remediation scripts although, these two topics will be covered in some detail/specifics as it applies to these scripts.
Zero: Complete the Requirements!
Make sure you have completed the above requirements! Again, the DCE (Data Collection Endpoint), Log Analytics Workspace, the policy to enable the needed logs, and the Function App along with correctly set DCE permissions are required to progress beyond this point.
1: Sample Data
This is normally the part where we download the script and use it to generate sample data which is then used to create the DCR/Table. Using your machine to generate sample data is beneficial as it verifies your ability to produce data. However, given the reliance on the previously created policy being properly deployed and active on your device (which may require a reboot), as well as events then being generated by you taking actions on that device, as well as the need to look through filtering, there is simply too much of a risk of failure/issue here.
Instead, and much more simply, I am just going to give you a piece of sample data to use. The AppUsage-SampleData.json can be downloaded from my GitHub here. These two fake events in this example have all it takes to generate our DCR/Table.
We are still going to swing around to running the script and verifying the data it produces from your machine later.
2: Table and DCR creation
Once downloaded, you’re ready to use the AppUsage-SampleData.json file as sample data such that you can create your DCR and tables. If you need an in-depth guide on this, refer to this blog post. That said, I still have a thorough guide below.
- You need to open up your Log Analytics Workspace and look for Tables on the left-hand side.
- Then choose Create, New Custom Log (DCR-Based)

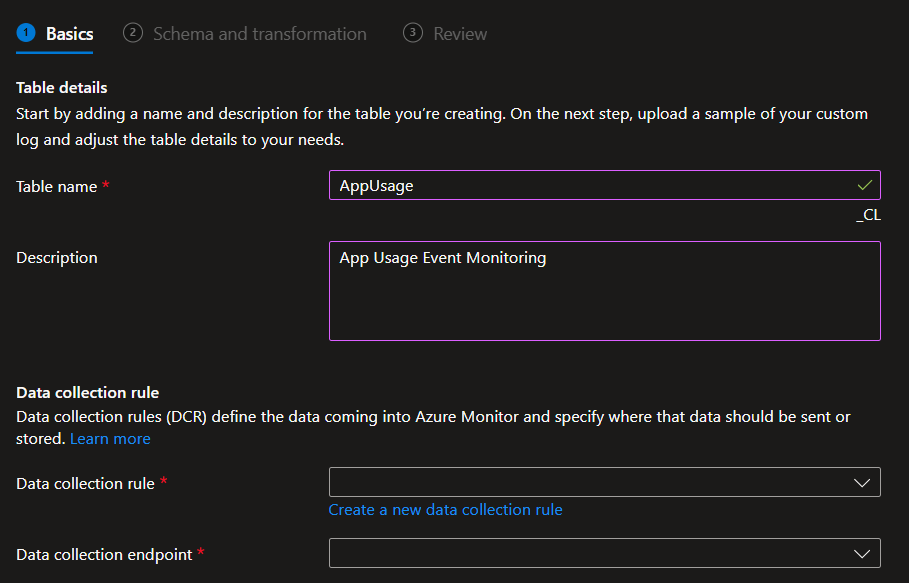
You will then be prompted for a Table Name and Description. The table name we will be creating is “AppUsage” (no quotes, NO _CL). While you could pick a different name, doing so would blow up all the queries in the workbook I will provide in the next set of this series. You could then also alter the workbook but I do not advise this.
Warning:
- The table name is case sensitive! Type it exactly or just copy paste. Again, failure to mirror this will break the provided workbook.
- The _CL is automatically appended to the table names. That’s expected. Do NOT manually add the _CL yourself.
Here is how it should look.
You then need to choose Create a new data collection rule. I would recommend you ALWAYS make a new DCR for every table.
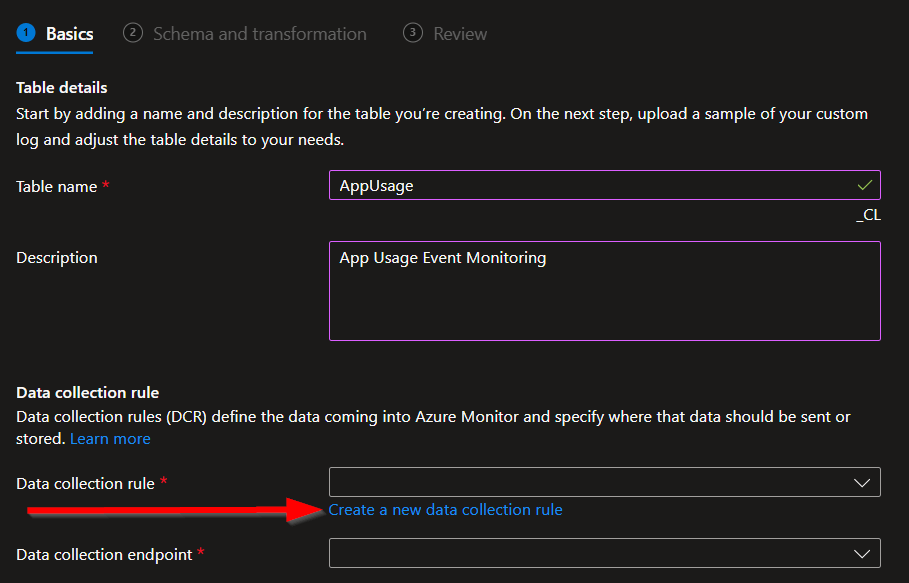
I will be naming mine to match my table name.
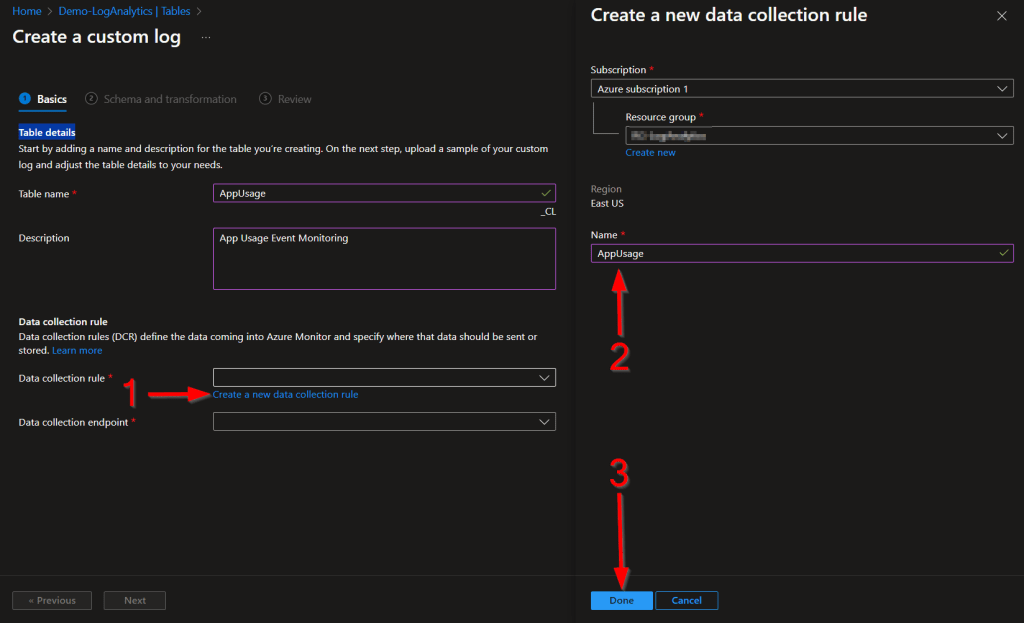
You then need to choose your existing Data Collection Endpoint. Again, you should already have one of these.
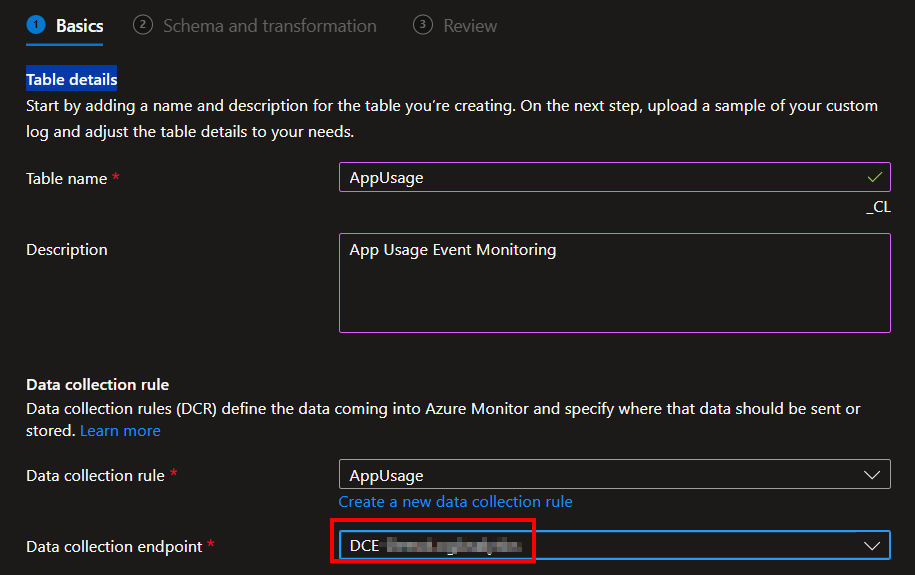
Once done, hit Next. You will then be prompted for a JSON-formatted sample data file. This is where you upload the provided AppUsage-SampleData.json.
You should then see the same data as shown below. You will likely see the same red warning that TimeGenerated was not provided, this is normal.
Writers’ tangent: Originally my sample data used a ComptuerName of S-12456 (S for sample) but for some reason, once the transform was put in place in the sample data menu, this caused it to stop displaying a value in the ComputerName column or to simply not display the column at all. Upon creation, the DCR was created as expected with the field showing as a string, but the Table schema showed it as a DateTime value. Odd!

As shown below, click into the Transform Editor, provide the below query, hit Run, and then Apply. You should then be able to hit Next and continue past this page.
source
 | extend TimeGenerated = now()
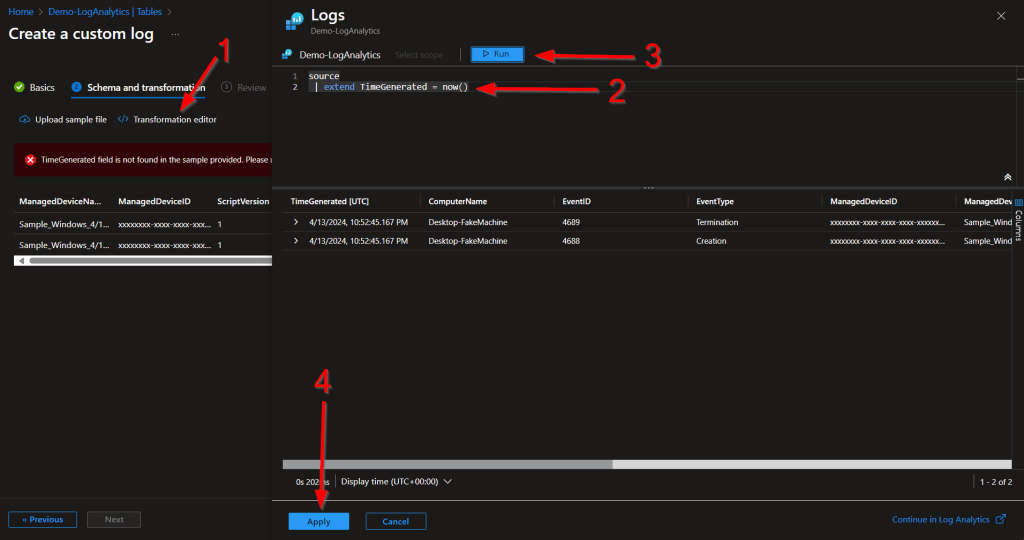
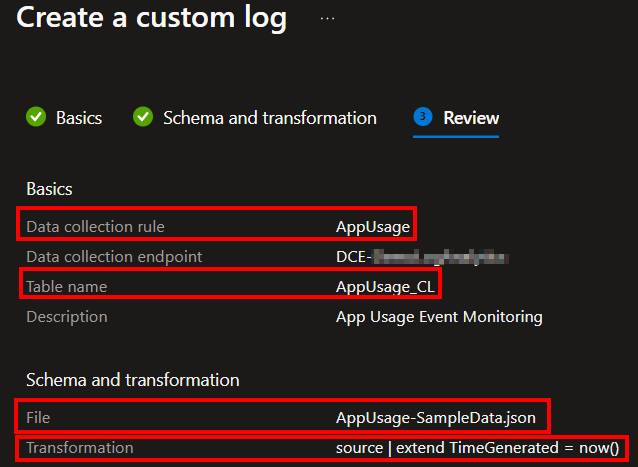
This is how the final page should look. If yours matches, go ahead and complete the setup by pressing Create.
Note: The automatic _CL will now be appended to the table name.
Congratulations, you now have your table and DCR!
Warning: Expect to be kicked out of the table menu and not see your new table. While DCRs generate and display almost instantly, tables do not. Give it time. Strangely, leaving and coming back to the menu does not speed this up. However, closing the tab and opening a new one, then returning to the same menu does seem to work.
3: DCR Permission
Now we need to grant our Function App permission to use the new DCR we just made. If you made an App Registration (optional) as discussed in the learning series, you will also need to grant it permission to the DCR if you want to be able to locally test and upload data.
Exact details on how to grant this permission can be found in this guide under the Granting DCR Permissions header. That said, I will still recover it in almost full detail.
You need to open the Azure Monitor menu, scroll down to Data Collection Rules, and locate the new rule we just made.
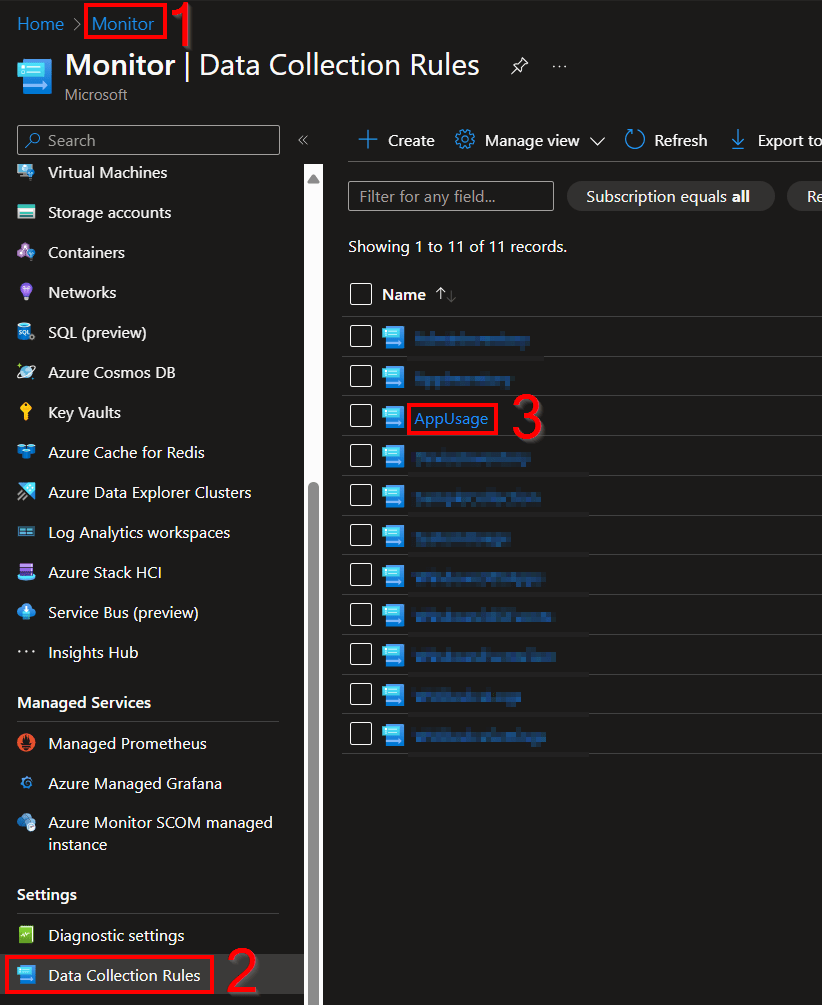
Go into the new DCR, go to Access Control (IAM), and Add Role Assignment.
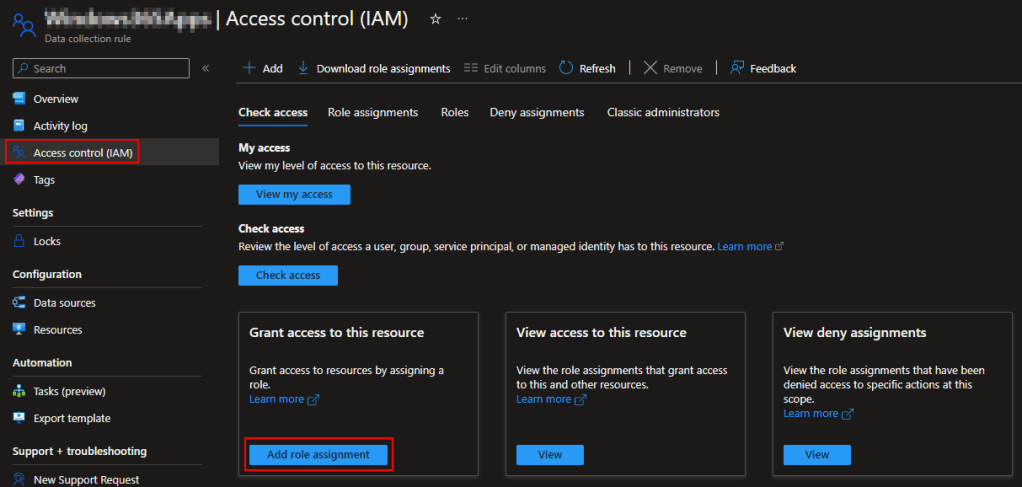
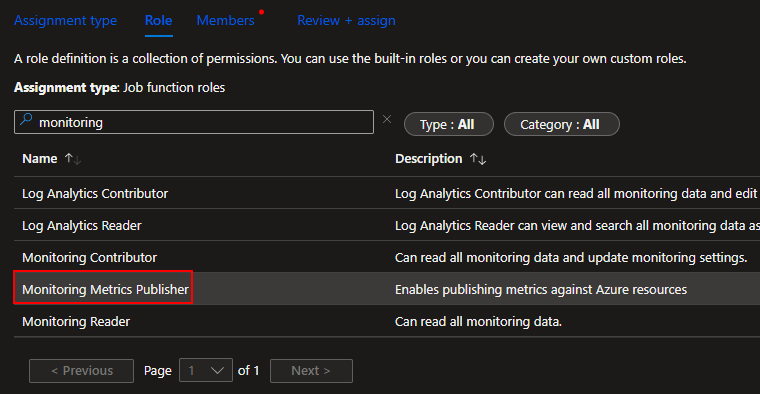
We need to add a Job Function Role, not a Privileged Administrator Role. (They keep changing this menu, you may no longer be prompted for this.)
Search and select the Monitoring Metrics Publisher role and press Next.
The easiest route to find and select a Function app is by changing it to Managed Identity (1), choosing Select Members (2), changing to the Function App view (3), and choosing your function app (4) which will add it to the selected member’s section. Then choose Select (5).

Finally, hit Review and Assign to assign the permissions. Now your Function App has permission to upload data to this DCR we just made.
4: Validating the Script:
While our permissions are setting in, we’re going to play with the script and make sure you’re getting the data you should be by generating some sample data.
First things first, head back out to my GitHub and download the file ATTM Application Usage Script V1.ps1. This must be downloaded onto a real and in-use device, one which has had the event policy deployed to it and had use occur on it to generate events.
Open this file in Visual Studio Code (VSC) with the PowerShell extension installed. Additionally, and this only applies to running it manually and not deployment, you may need to run VSC as either system or, elevate the user who enrolled the device to a local admin and run it that way. Other admins (those who did not enroll the device) may not have the right permission to read all values the script needs to work.
The script has a large variables region near the top with many adjustable variables listed. I will go into more detail on what these do as part of the deployment section later. For now, locate $WriteLogFile and change it from $False to $True. Then, run the scripts with F5.
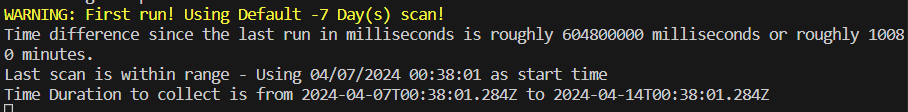
Initially you will see output like this.
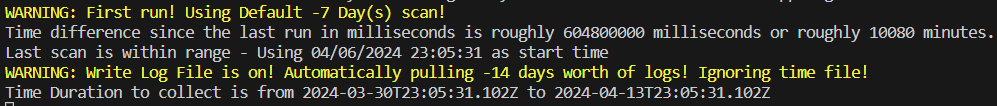
This might read somewhat confusingly. It’s the Time Tracking saying that this must be your first run as no tracking file exists, so it will use the first run interval of 7 days, only to be overridden by $WriteLogFile being enabled and instead using 14 days.
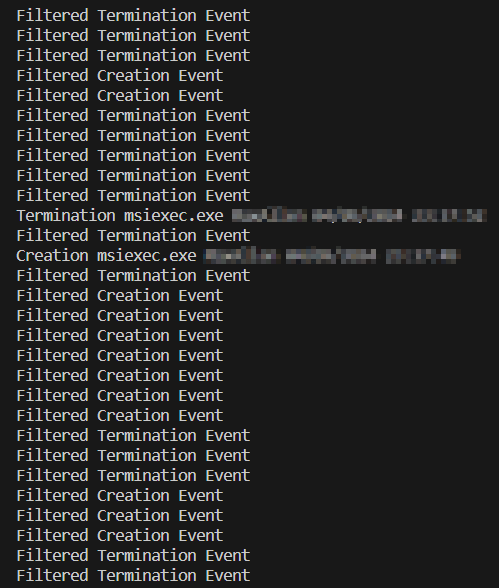
Depending on how long the policy has been in place and how many events have generated in that time, the script may seem to pause for some time as it is combing through a full two weeks (at most) of data. After a moment, it should spit out a bunch of lines indicating various events were found. This will likely be a LOT of “Filtered Creation Event” and “Filtered Termination Event” with sporadic lines reading something like “Creation CMD.exe Bob 04/13/2024 12:00:00.’
Note: If you see an error that no events were found, something is wrong. It’s almost impossible to be on your machine and not have something generating at least background events. Double check your policy, the scoping of said policy, that the policy has reached your unit, and perhaps try restarting. Manually validating the presence of the Event IDs in your Security log would be the next step.
It will then end in this. Unlike my other collectors which only noted the total events they were going to upload, this collector notates the total unfiltered count versus the count of events it wanted to actually upload, as well as displaying that ratio as a percentage. Yes, that means of all the thousands of events found in the past 14 days, 8,489 were filtered out leaving us with only 203 that we actually care about, a whopping 2.39%. Remember, filtering is key to cost savings with this collector, so keeping an eye on this in testing is good.

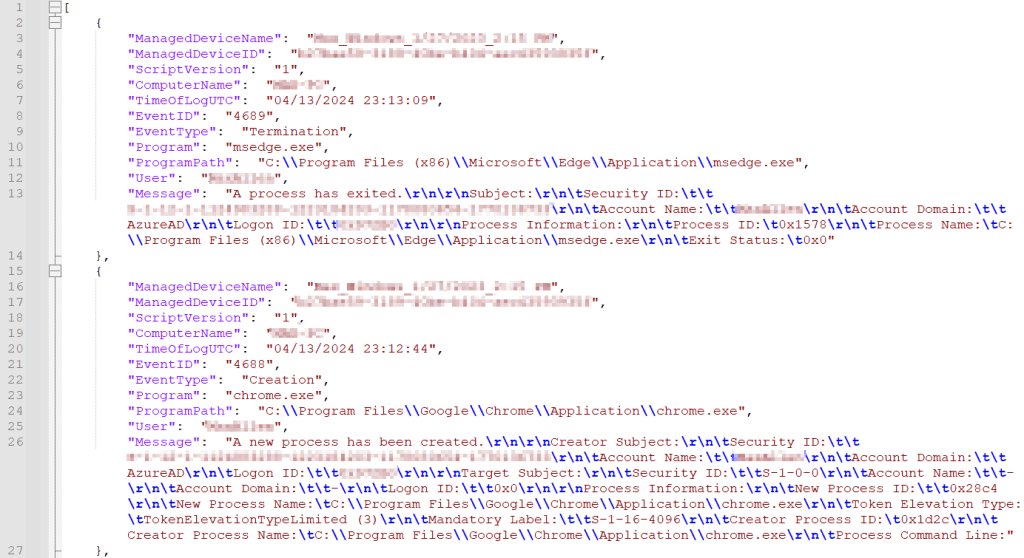
You should now be able to look in C:\Temp\LogAnalytics and have a set of two files. That being AppUsage-Full.json and AppUsage-RAW.json. Go ahead and open the RAW file in your favorite text editor.
The RAW file should have something like this, entry after entry after entry of various events. Look through your events and make sure you are seeing what you expect. This is the same data that will ultimately get passed into log analytics. If any of the values are missing something may be wrong.
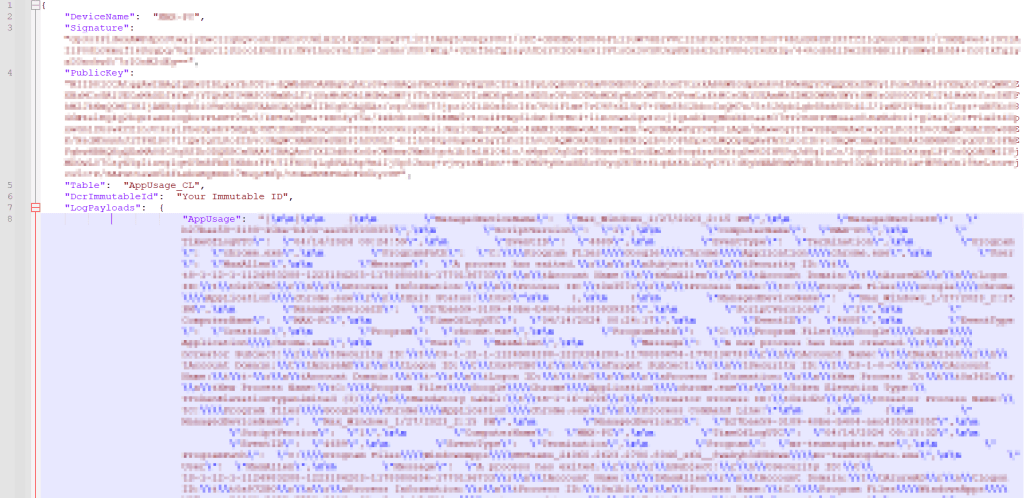
If your data looks good, go ahead and open the FULL file. There will be a AppUsage array containing all the same data in a slightly more compact format, a DCRImmuableID which will show the generic placeholder text as seen below, the Table should be as shown (AppUsage_CL), and you should have a large Signature and PublicKey value. If any of these are blank (except possibly DCRImmutableID) something is wrong, and you might not be able to upload data. I would first look at the multiple suggestions in this article about being an admin or using the system account.
If all looks well and as expected, you can move onto uploading the data.
5: Let’s Upload some Data!
Head back to the Azure Monitor menu, go back inside our DCR, go to the Overview and choose JSON view on the far right.
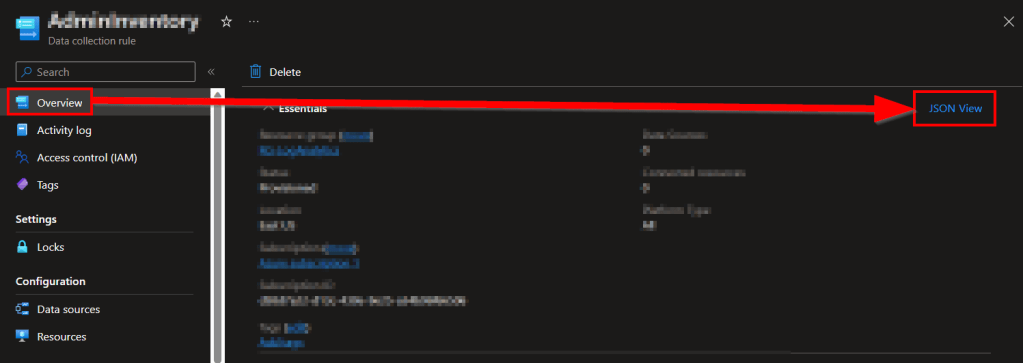
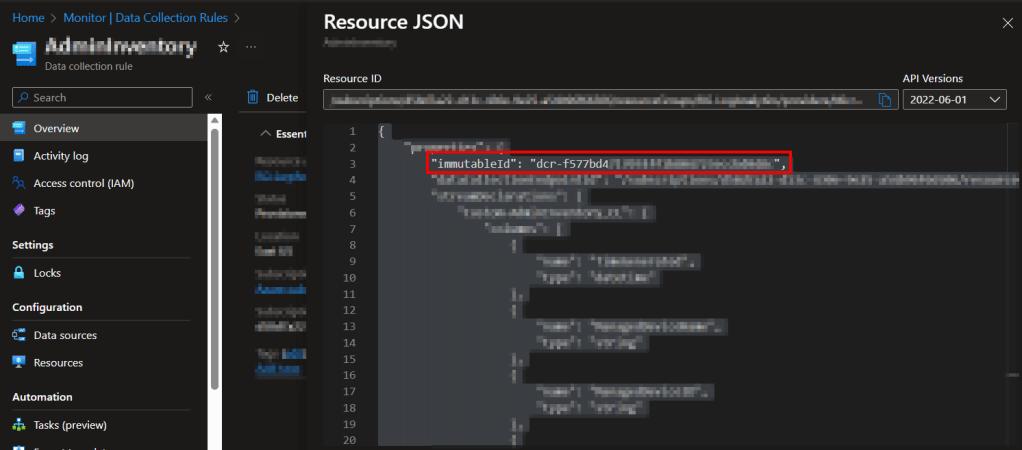
Inside the JSON view, grab the immutableId value.
Now, head back into Visual Studio Code. These steps are to get us ready to upload data.
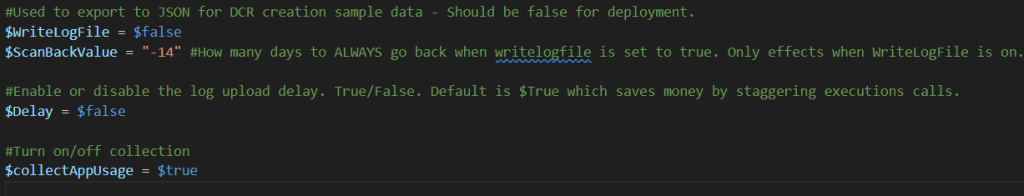
- – In the variables section, change $WriteLogFile back to $False.
- – In the same variables section, turn $Delay to $False. You can see this or just read the script comments to know what this does. We will eventually turn this back on.
- – In the same variables section, you will find $DcrImmutableId. Paste the value of the ImmutableID you just gathered here.
- – Lastly, fill in $AzureFunctionURL with your Function Apps Function URL with the Default Function key. If you’re not sure where to get this, see the Getting the Function App URI section here.
Note: Regarding getting the Function App URL – Microsoft decided to shake up the box and change the Function App menu again, fun. I have written new details in the learning series linked above. See the section of that blog labeled “Update 8/8/23: Changes to the Function App Menu.“
In the end, it should look like this.
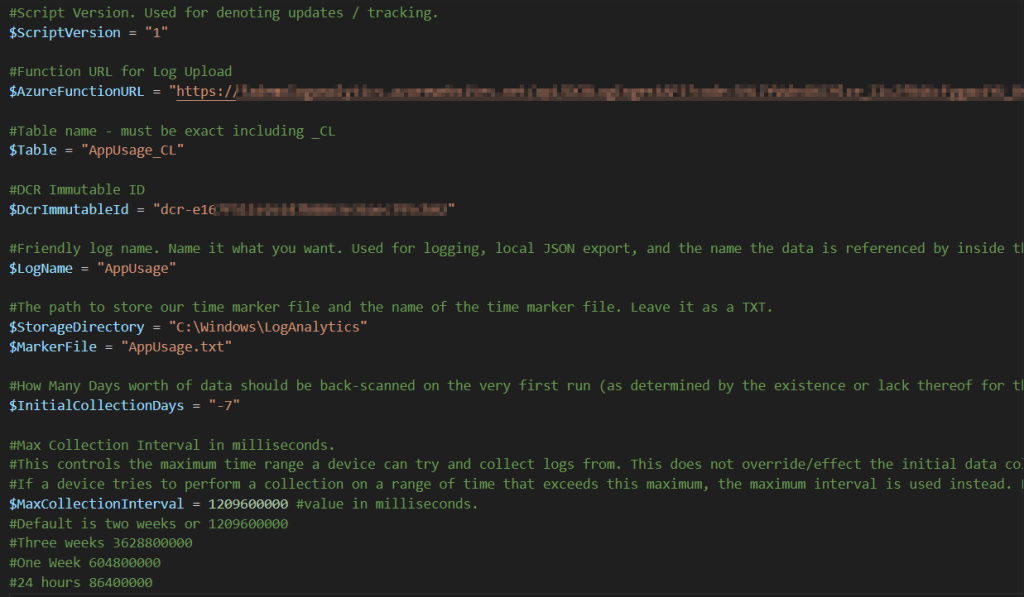
Next, I want to talk about $InitialCollectionDays. When the script runs, it’s going to look for its marker file of when it last ran to determine what time range to pick up events from. This file location & name are controlled by $StorageDirectory and $MarkerFile respectively. On the first run, this file won’t exist, so it gets created and a value of now added for next time. Since the script can’t currently calculate a time range since there was not yet a file, $InitialCollectionDays tells the script how many days back it should go ahead and try to collect events from on this first run. By default, it’s -7 (needs to be a negative value). You can change this if you want but I wouldn’t go past two weeks (-14) because…
While we are on this topic, $MaxCollectionInterval is used to control the maximum time range a device can attempt to pull logs from. By default, this is set to two weeks (-14). If a device ever tries to collect data from more than a two-week time range, it will instead be forced down to this maximum interval. Because of this, your initial collection interval cannot exceed your maximum collection interval. The max interval is for situations like a device that hasn’t been turned on in 2 months and thus has a value in its time tracking file from two months ago. This function prevents it from trying to run a query over excessive time periods.
Back on track – In order to upload data, assuming we are still on the same device you used to generate the above sample data, I would recommend you first delete the now existing marker file C:\Windows\LogAnalytics\AppUsage.txt. I recommend this because this marker file would have been created and populated with the run time of our sample data creation. That means if you were to simply run the script right now, it would only scan the time range from then (when we made the sample data) to now. By deleting the file, the script will need to regenerate the file and will thus use $InitialCollectionDays for its range, and thus pull 7 days’ worth of data.
Once that file is deleted, you can go ahead and execute the script with F5. You should see something like the following…
First, similar to when generating the sample data, time tracking will see the marker is gone and thus use the $InitialCollectionDays.
It should find events although not quite as many as the sample data because that used 14 days whereas this only uses 7. Because of this, it should also process a bit faster.
It should then send those logs and report an OK status with a 204 response. It will also indicate the size of the payload as well as the total number of logs it found to upload.

Note: If you do not get a success status, check the DCR ID you got, the DCR permissions, the Function App URL, and the Function App to DCE permissions. For more help, see this article here for troubleshooting. The information in that article is primarily for the learning series but the same concepts apply. Assuming your Function App works, odds are it’s a Function App to DCR permission issue or, you got the various DCR IDs mixed around. If you have a lot of trouble and this is your first attempt to use my Function App ever, I highly advise going through the learning series to make sure you can get its sample collector to work and thus we know your Function App works.
Assuming you received a success, go ahead and run the script again immediately. You should notice that it processes much faster. This is because the range it captured was only from when you last ran it moments ago to now. If you run it fast enough, you may see something like the below indicating no (unfiltered) events were found to send, or even possibly an error indicating no events were found at all.
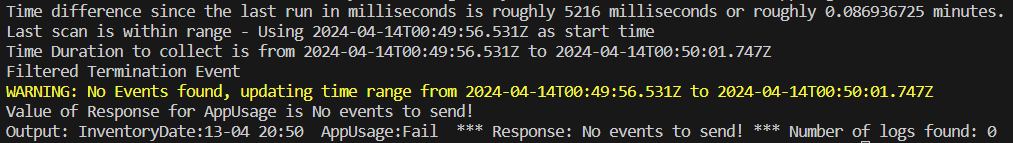
Because it found nothing to send in that range, it updated time tracking to the time of this run as there is no point in re-scanning a period of no events on the next run.
At this point, we are ready to validate our data’s arrival.
6: Validating Data Arrival
It may take up to 10 minutes for the new data to populate your table. Eventually, you should be able to go into Log Analytics, choose Logs on the left, and view the records we just sent. For example, here is my initial ingestion into the AppUsage_CL table.

If your table appears to not exist yet (typing the name gets you a red underline) or does not yet have any data, try waiting and clearing your cache. These menus are strange with updating when it comes to first receiving data to new tables or columns.
Once you see your data, congrats! All* of the hard work is done!
*There is still the topic of filtering which I will briefly touch on here.
FAQ:
What about filtering?
Obviously, filtering has been a large part of the discussion for this collector. Your primary way of identifying outliers, specifically things you may not want to ingest, will be through the Workbook dashboard which we will setup in the next section. However, if you have any immediate concerns, look for the comment “#This is where various users, programs, paths, etc, are filtered.” which appears twice in the code. This is just above the line that has all the filters for the events on them. One if for creation, one is for deletion, you will figure it out.
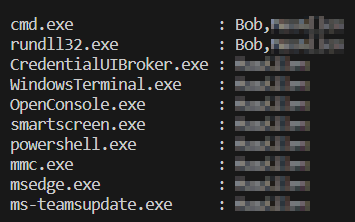
Additionally, you may find the value of the variable $TempArrayAppListCreation and $TempArrayAppListTermination interesting. These two arrays aren’t currently serving a purpose in the code but are useful for a quick glance at filtering possibilities. They contain a table of every application created or terminated respectively, along with the users who launched/terminated them. It’s unique combinations only, so you will only see one entry per combination. For example, below we can see that cmd.exe was launched by two users, as well as rundll32.exe, while the rest were only launched by one user. This helps identify users and/or apps you may not want to be picking up although again, the workbook does this too and in a much simpler fashion.
What is with the long processing times?
This question is mainly in comparison to the other collectors which are all fairly fast, even the other event collectors.
The difference is because of the amount of events and the time range we have been looking at. So far, we have been doing scans in the range of 7 to 14 days with events ranging from 5-10 thousand. Normally this collector will run on an hourly basis where the event count is small and thus run time is short. The only time it should have more than an hour gap is when the device was off, of which there won’t obviously be any events to look through. Feel free to manually run the script again periodically for the next few hours in which case you will see it’s much faster when it’s just running a quick scan of a small range.
I wish there was a way to better filter things out in the XML query of the event log itself, as that would cut back the amount of results and thus drastically speed the event search up, as well as reduce the amount of thing we then need to filter further, but so far getting that to operate reliably has been an issue.
Conclusion:
You should now have your DCR and table created, the script mostly configured, and some initial data ingested! That’s the hard work done! Next is the workbook importing, script deployment configuration, and deployment details.
The Next Steps:
See the index page for all new updates!
Log Analytics Index – Getting the Most Out of Azure (azuretothemax.net)
I will be putting the System Usage guides on the Log Analytics Index page under the System Usage series.
Authors note:
WordPress seems to be having a lot of fun changing up my editor recently. Between the time I started this and then eventually circled back for a finalization pass, my editor stopped respecting my sites dark theme. So, if I missed any typos or something like that, I apologize, but my retinas were getting fried while editing this. I also noticed some oddities around list formatting, hopefully I got all that fixed.
Disclaimer:
The following is the disclaimer that applies to all scripts, functions, one-liners, setup examples, documentation, etc. This disclaimer supersedes any disclaimer included in any script, function, one-liner, article, post, etc.
You running this script/function or following the setup example(s) means you will not blame the author(s) if this breaks your stuff. This script/function/setup-example is provided AS IS without warranty of any kind. Author(s) disclaim all implied warranties including, without limitation, any implied warranties of merchantability or of fitness for a particular purpose. The entire risk arising out of the use or performance of the sample scripts and documentation remains with you. In no event shall author(s) be held liable for any damages whatsoever (including, without limitation, damages for loss of business profits, business interruption, loss of business information, or other pecuniary loss) arising out of the use of or inability to use the script or documentation. Neither this script/function/example/documentation, nor any part of it other than those parts that are explicitly copied from others, may be republished without author(s) express written permission. Author(s) retain the right to alter this disclaimer at any time.
It is entirely up to you and/or your business to understand and evaluate the full direct and indirect consequences of using one of these examples or following this documentation.
The latest version of this disclaimer can be found at: https://azuretothemax.net/disclaimer/
