Let’s get right into it. Following our last post, here is how you actually set this monitoring up. This part will cover the creation of the DCR’s, Tables, and initial data ingestion. Setup of the workbook as well as the true deployment of the collector scripts will come in part three.
Again, I cannot possibly recommend enough that you go through the entire learning series V2. If you review this material, this setup will make a lot more sense from a technical/cost/logical standpoint. I will not be doing a deep dive recover of all of that material as many of the elements are exactly the same. When such an element comes up, I will reference back to those articles.
In this section we will cover…
- Requirements
- Zero: Complete the Requirements!
- 1: Sample Data
- 2: Validating Sample Data
- 3: Table and DCR creation
- 4: DCR Permissions
- 5: Lets Upload some Data!
- 6: Validating Data Arrival
- Conclusion
Requirements:
Note: If you previously followed V1 of the Windows 365 guide, you do NOT need to redeploy your Tables and DCRs. Just create the new Function App and in this article we will grant it permission to the same DCRs you already have.
Before you can proceed with this article, you will need to complete and deploy the following items from the learning series.
- Log Analytics Workspace and Data Collection Endpoint
You will need a DCE (Data Collection Endpoint) to run your Data Collection Rules (DCR’s) through. You will also need a Log Analytics Workspace to import that data into. Both the DCE and workspace are “generic” in the sense that you just need one of each to exist in the right region and preferably inside the same Resource Group as everything else that will be setup. That said, I would recommend you get a Log Analytics Workspace just for this workbook or, at the least, just for custom PowerShell based logging like this. - Function App
For this you will need a setup Function App running the provided code. This is again a “generic” item in the sense that you just need one to exist in the right region and preferably inside the same Resource Group. All (updated for new auth) collection scripts I make can use the same singular Function App and code which was deployed in the learning series V2.
Note: Completing this section requires that you have a DCE setup first. Make sure you not only complete the deployment of the Function App but, also complete the permissions in the section named “Assigning the Function App Permissions”. - Configuration of Auditing of Other Logon/Logoff Events for RDP disconnect logging.
- Intune Proactive Remediation compliant licensing
- Visual Studio Code with the PowerShell Extension. You can use ISE if you must. For sample data, you may need to run it as either system or elevate the account that enrolled the device to local admin. Other admins (those who did not enroll the device) may not have the right permission to read all values the scripts need to work.
- I would recommend you get familiarity with the creation of a DCR and deployment of proactive remediation scripts although, these two topics will be covered in some more detail/specifics as it applies to these scripts.
- Your regions need to have different network IP ranges. If, for example, both your India region and US region Windows 365 devices use say a 10.1.0.0/16 scheme, the region filtering won’t work. As long as the scheme is somewhat different, say 10.1.0.0/16 and 10.2.0.0/16, it will work. I highly doubt any organization would be using the same exact schema for two different regions. It would almost certainly not be best practice.
Zero: Complete the Requirements!
Again, make sure you have completed the above requirements! Again, the DCE, Workspace, Function App and its permissions, and the deployment/creation of a policy to enable logging of the needed Windows events.
1: Sample Data
Like everything I seem to write about, this is a bit of a chicken and egg situation. We need to create a Table and DCR, two each actually, but in order to do that we need sample data and in order to get that we need to use the scripts. As such, first you need to download the two V2 collector scripts here onto a Windows 365 (Cloud PC) device. The two files are Windows365EventCollectorV2.ps1 and Windows365AppCollectorV2.ps1. These must be downloaded onto a real and in use cloud PC as our goal is to generate realistic sample data!
Open both files in Visual Studio Code (VSC) with the PowerShell extension installed. Additionally, and this only applies to sample data and not deployment, you may need to run VSC as either system or, elevate the user who enrolled the device to a local admin and run it that way. Other admins (those who did not enroll the device) may not have the right permission to read all values the scripts need to work.
Both scripts have a large variables region near the top with many adjustable variables listed out. I will go into more details on what these do as part of the deployment section later. For now, locate $WriteLogFile and change it from $False to $True in both scripts. Then, run both scripts with F5. You should see output like this.
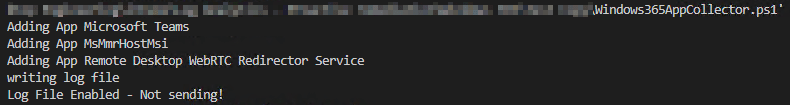
Windows 365 App Collector:
You may see 1-4 apps listed out before it then notes the log file is being written. You need at least one app listed to proceed; most devices will have three.
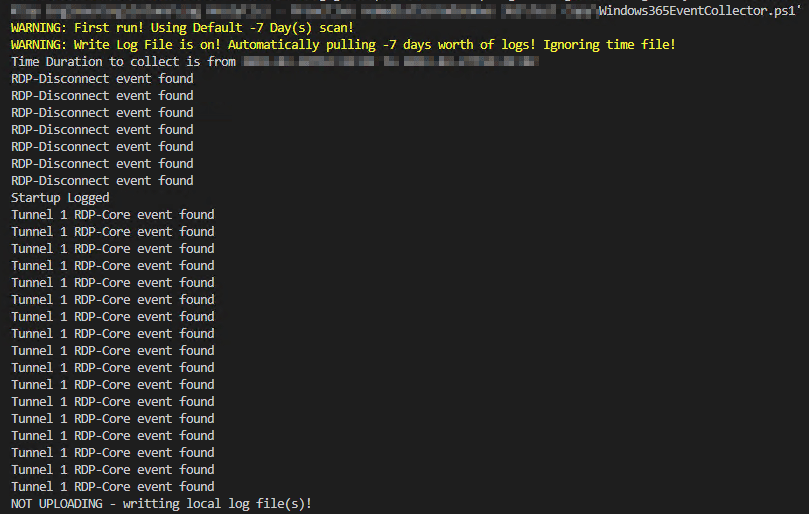
Windows 365 Event Collector:
The key here is that you get at least one Startup event (should never be more than one), one RDP-Disconnect event, and One Tunnel event. So long as you have one of each, you should be good to go.
If you don’t have one of each, just hit the X on the connection bar for the cloud PC session to disconnect from the device you are running these on. Then, reconnect and re-run the script as that should have generated one of both of those kinds of events. Remebmer, the logging of RDP disconnect events requires you to have specific auditing policy in place. See the requirements!
2: Validating Sample Data
You should now be able to look in C:\Temp\LogAnalytics and have a set of FOUR files.
- Windows365Events-RAW.JSON – Sample data
- Windows365Events-Full.JSON
- Win365AppInventory-RAW.JSON – Sample data
- Win365AppInventory-Full.JSON
The two RAW files are our sample data. The Full files are what we would have sent to the Function App. Both need to be validated to make sure things are working as they should be. Open up all four files in your favorite text editor and follow along below.
Note: The “ScriptVersion” field has been updated to 2 and will appear that way in your logs but not the pictures below.
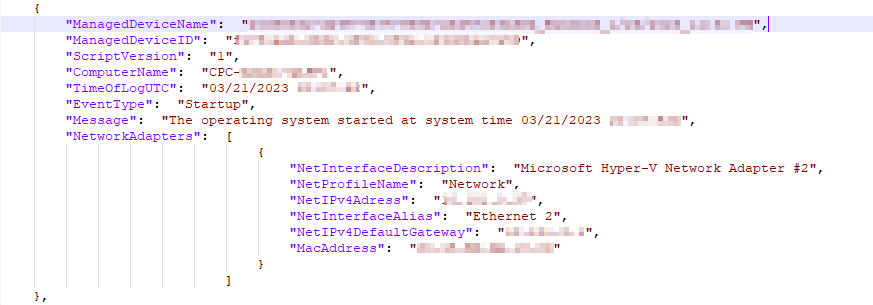
Windows365Events-RAW.JSON:
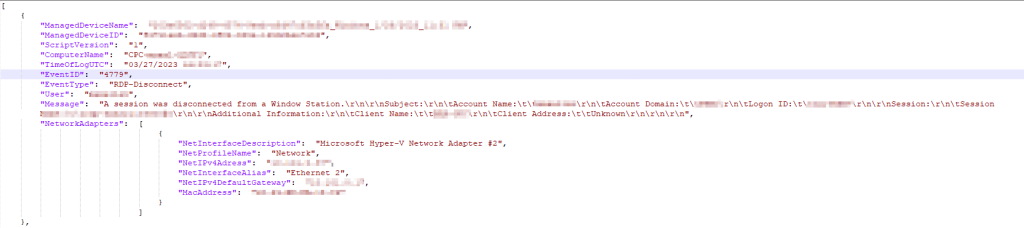
This file should have a multitude of entries detailing Windows events. Again, you should have at least one entry for all three kinds of events. RDP-Disconnect, Startup, and TCP (or UDP) Connection. Since I know these pictures compress a good deal, below you will find how each single event will look one-by-one. You should see that each entry contains event information as well as information about the device including its Intune ID, Intune Management Name, and network information. You should see all the same information filled in that I do.
RDP Disconnect:
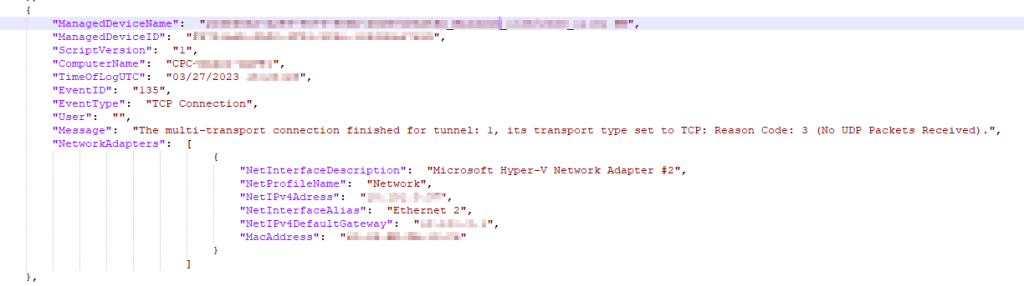
TCP/UDP Connection:
It’s normal for the user to be blank as these events don’t have a corresponding user.
Startup:
Again, these are calculated using the current time minus the uptime. This is accurate to within a few seconds of the actual event but does not run off a real event, hence no event ID. More on this later.
Windows365Events-Full.JSON:
This one is fairly straight forward. You should see your Device Name, a long value in the signature field, and even longer value in the public key field, the Windows365Events_CL table, a blank DCR ID field (unlike below), and then a likely rather large and messy looking array which is actually the same data we just looked at in another format (Windows365Events).

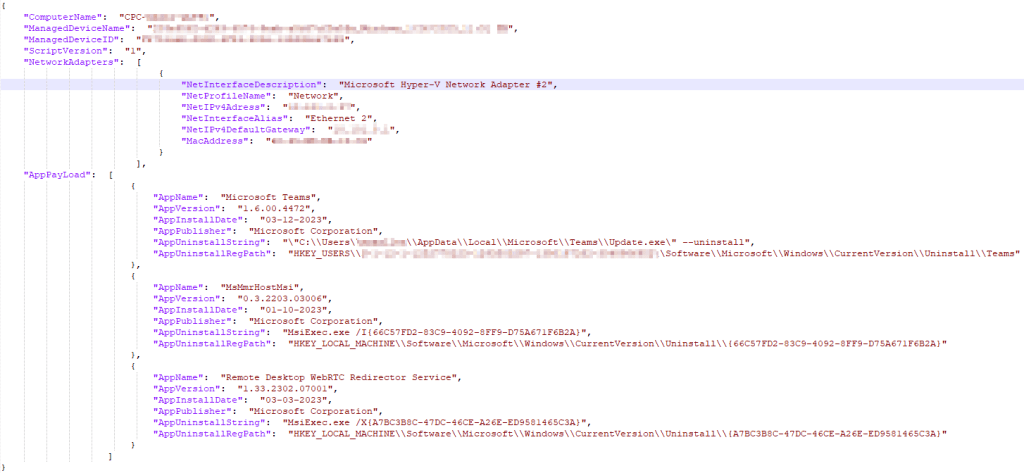
Win365AppInventory-RAW.JSON:
This one is a bit more complicated. Like the other RAW you will see an entry for the Computer Name, Intune ID, Intune Management Name, and Network Adapters. Differently, there should be an array named AppPayLoad containing various entries for the apps on your machine which details the Name, Version, Install Date, Publisher, Uninstall String, and Uninstall Path. This should contain whatever apps you saw in the script output originally which will typically be just three of four possible.
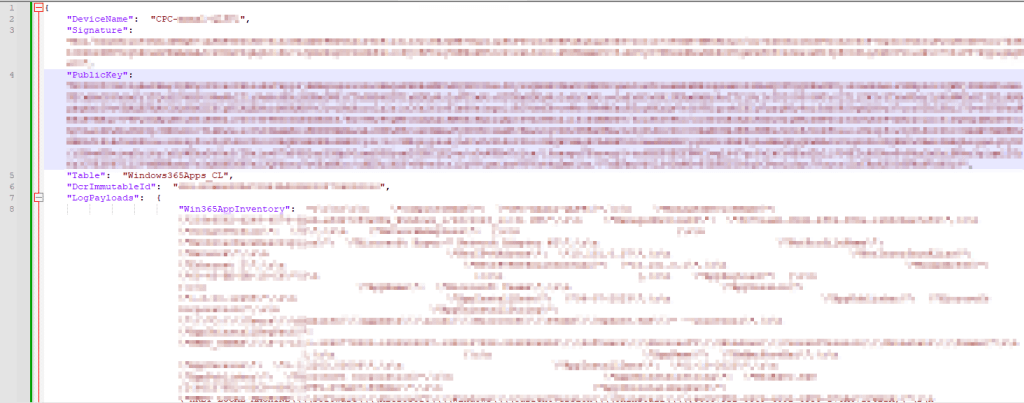
WindowsAppInventory-Full.JSON:
Again, this one is fairly straight forward. You should see your Device Name, a long value in the signature field, and even longer value in the public key field, the Windows365Events_CL table, a blank DCR ID field (unlike below), and then a likely rather large and messy looking array which is actually the same data we just looked at in another format (Win365AppInventory).
3: Table and DCR creation
Assuming your data looks good, you’re now ready to use the two RAW.JSON files as sample data such that you can create your DCR and tables. If you need an in-depth guide on this, refer to this blog post. That said, I will still provide a fair number of details here.
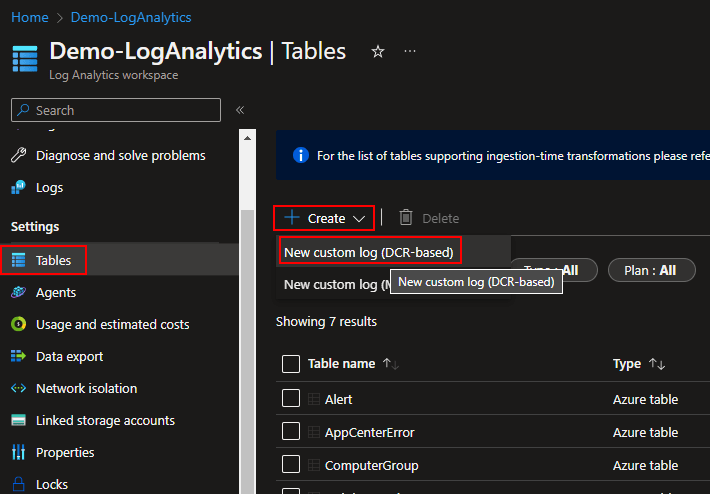
- You need to open up your Log Analytics Workspace and look for Tables on the left hand side.
You should have already created one of these as part of the requirements! - Then choose Create, New Custom Log (DCR-Based)
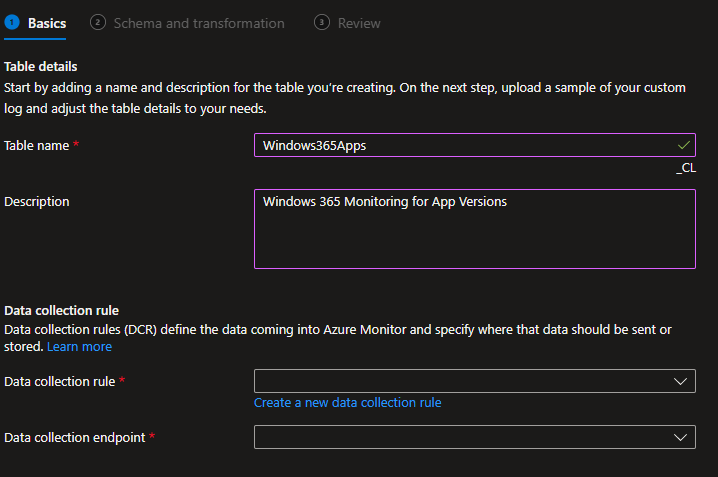
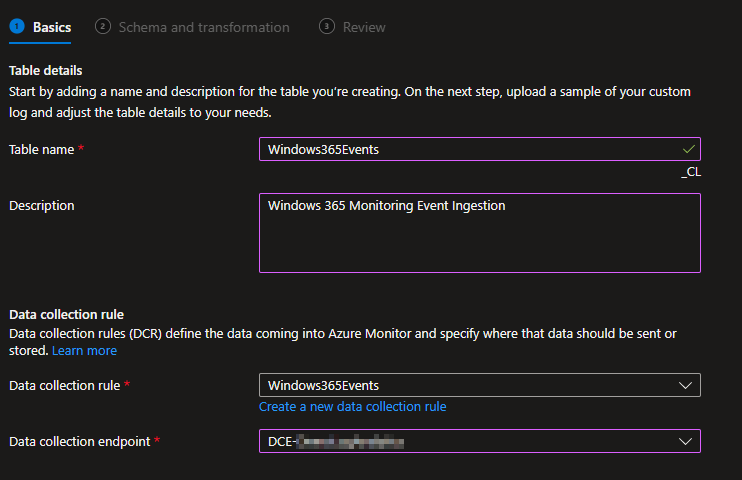
You will then be prompted for a Table Name and Description. The two Table Names we will be creating are…
- Windows365Apps (NO _CL)
- Windows365Events (NO _CL)
Warning:
- These table names are case sensitive! Type them exactly or just copy paste them. Failure to mirror this will blow the workbook queries out of the water and make a mess.
- The _CL is automatically appended to the table names. That’s expected, do NOT manually add the _CL yourself.
For the sake of example, I will be creating my app table first. Here is how that should look.
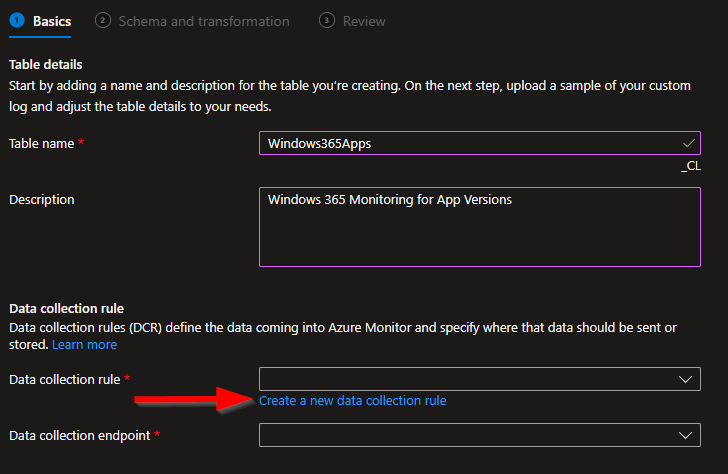
You then need to choose Create a new data collection rule. I would recommend you ALWAYS make a new DCR for every table.
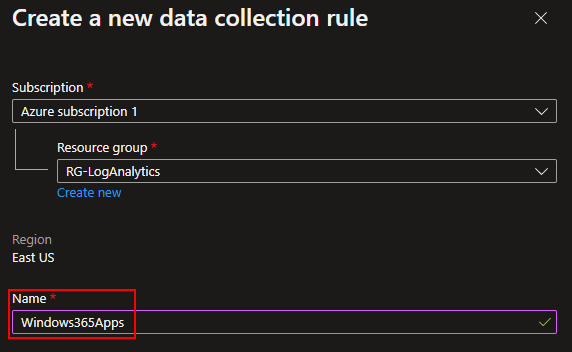
I will be naming mine to match my table name.
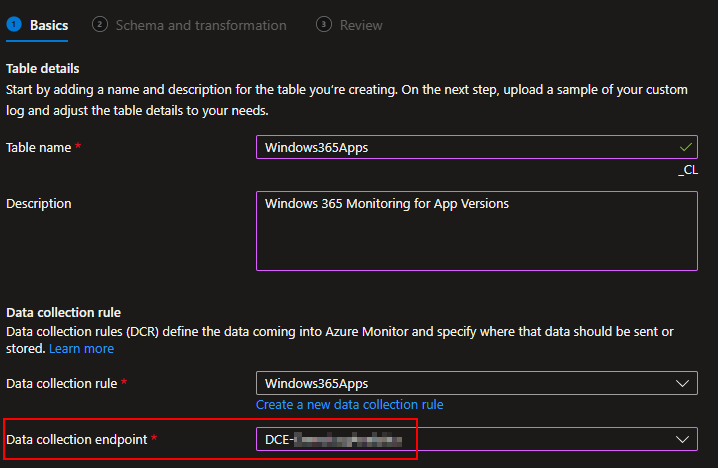
You then need to choose your existing Data Collection Endpoint. Again, you should already have one of these.
You will then be prompted for a JSON formatted sample data file. Since I am making my Windows365Apps table, I will upload my Win365AppInventory-RAW.json. Again, use the RAW file, not the full file.
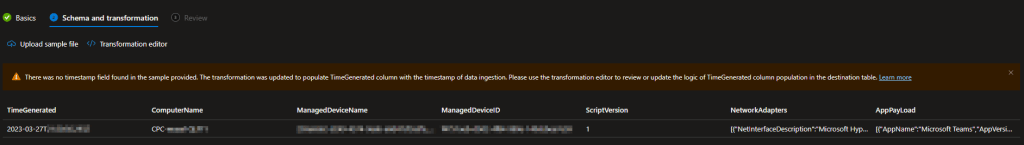
You should then see your same data with the same columns as in the RAW file appear. You will likely see the same orange warning as I did with a warning that TimeGenerated was automatically populated with the ingestion time. This is normal. If for some reason it’s red and just says it doesn’t know what TimeGenerated is, you need to manually specify it. Details can be found in my previous blog.
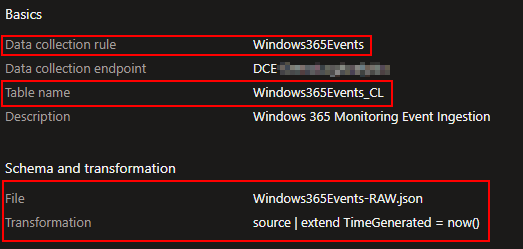
You will then see a confirmation of what you are creating. You should again see the DCR is named after the Table, the Table Name will now show it’s automatic _CL, the file you used should be the corresponding RAW file, and your TimeGenerated should be now().
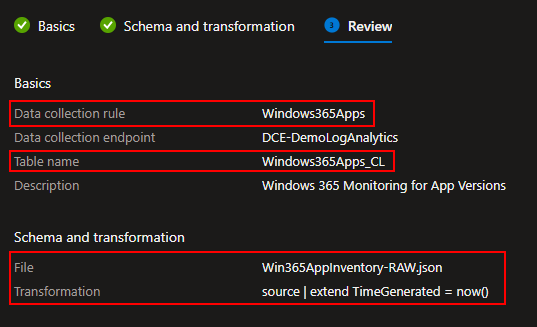
You can then go ahead and hit Create at the bottom.
Next, repeat it all for the other table.
You need to repeat all those steps using the Windows365Events name and Windows365Events-RAW.json file. I won’t recover these in full detail, but here is how it should look.
Again, don’t add the _CL manually.
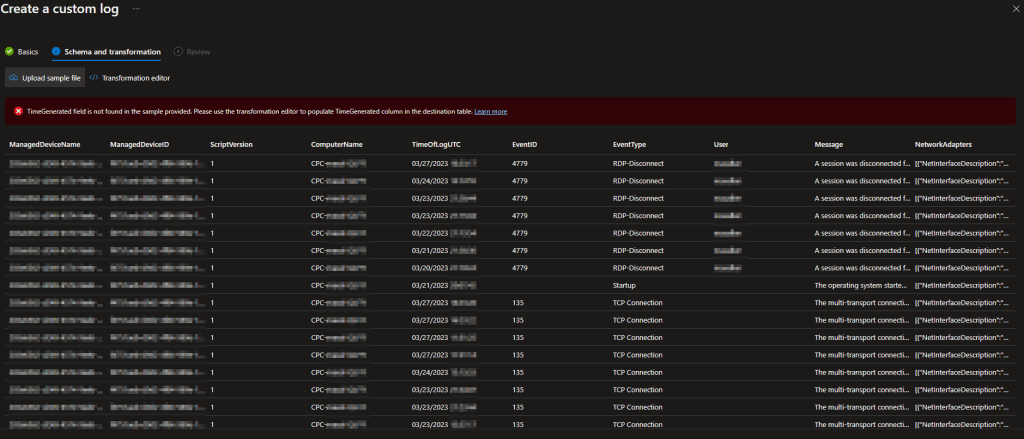
Strangely, I got the Transform Error this time around so I will be manually inserting it by clicking Transformation Editor just above the error. Don’t ask me why it sometimes automatically adds it and other times just errors.
source
| extend TimeGenerated = now()
This is how the final page should look…
And once completed, you should have both Tables and DCR’s created.
4: DCR Permissions
Now we need to grant our Function App permission to use the two new DCR’s we just made. If you made an App Registration (optional) as discussed in the learning series, you will also need to grant it permission to these DCR’s if you want to be able to locally test and upload to them. Exact details on how to grant this permission this can be found in this guide under the Granting DCR Permissions header.
That said I will still recover it in almost full detail. You need to open the Azure Monitor menu, scroll down to Data Collection Rules, and locate the two new rules we just made.
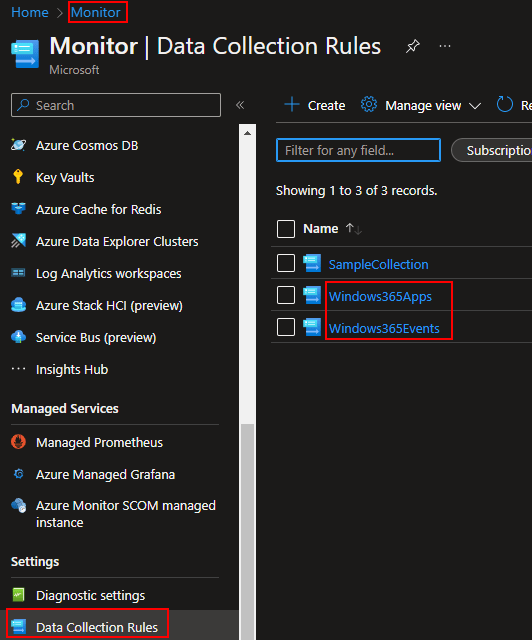
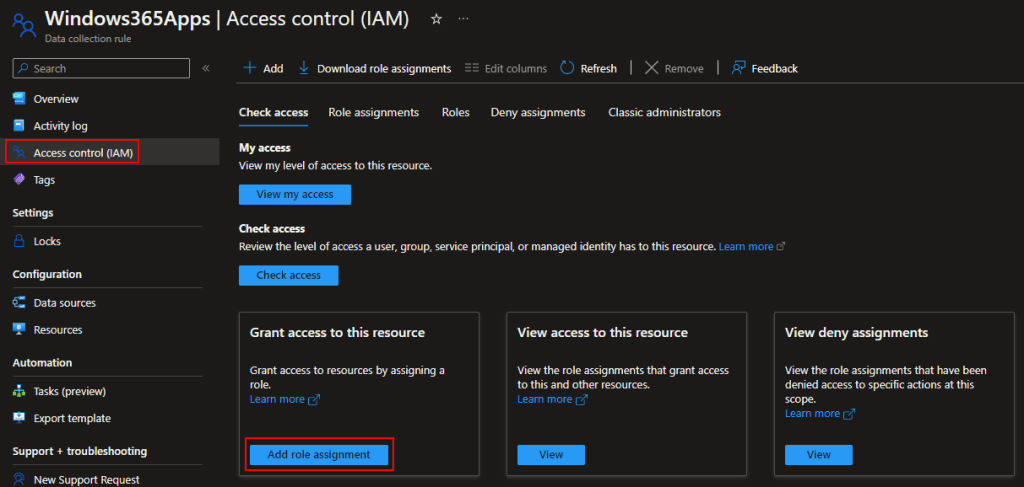
You need to then go into both the new DCR’s, go to Access Control (IAM), and Add Role Assignment.
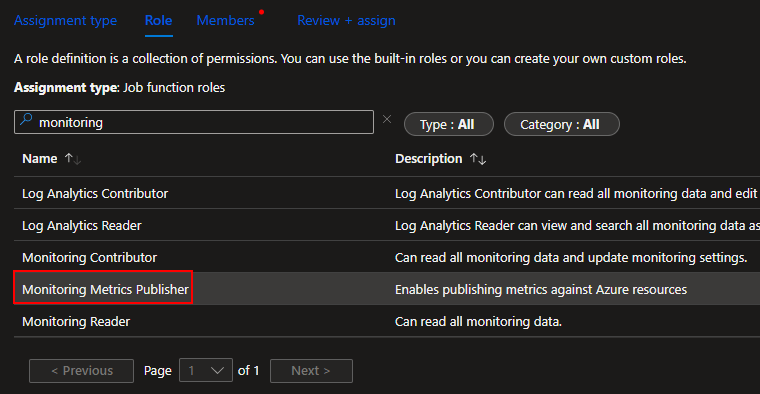
We need to add a Job Function Roles, not a Privileged Administrator Role. (They keep changing this menu, you may no longer be prompted for this.)
Search and select the Monitoring Metrics Publisher role and press Next.
The easiest route to find and select a Function app is by changing it to Managed Identity (1), choose Select Members (2), change to the Function App view (3), choose your function app (4) which will add it to the selected members section, and choose Select (5).
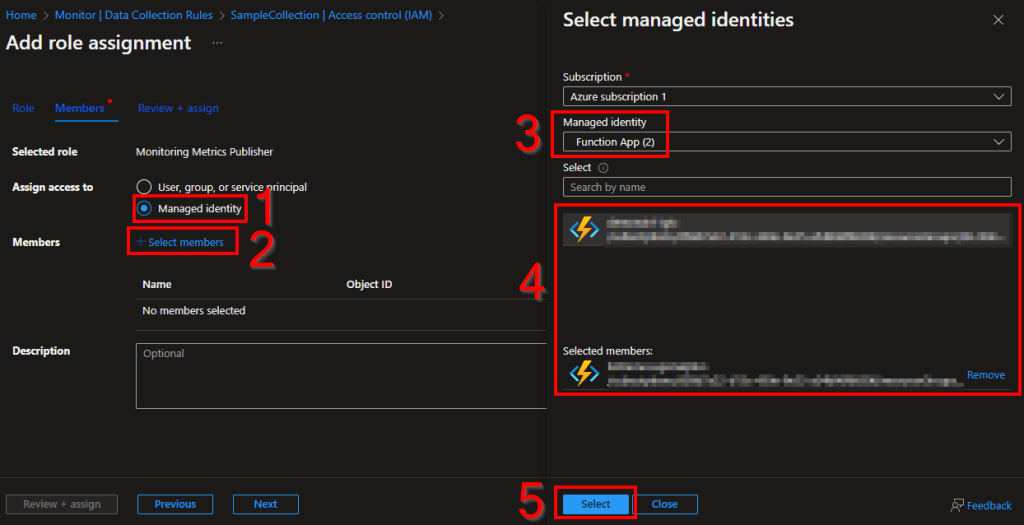
Finally, hit Review and Assign to assign the permissions. Now your Function App has permission to upload data to this DCR we just made.
Now, repeat that same permission process for the other DCR.
5: Lets Upload some Data!
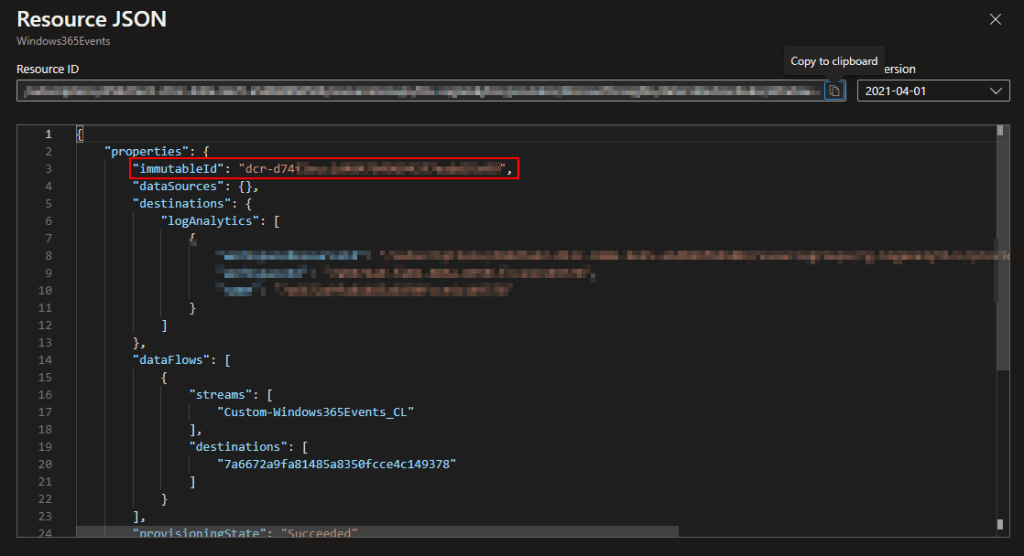
Still inside the Monitor menu and inside our DCR’s, go to the Overview and choose JSON view on the far right.
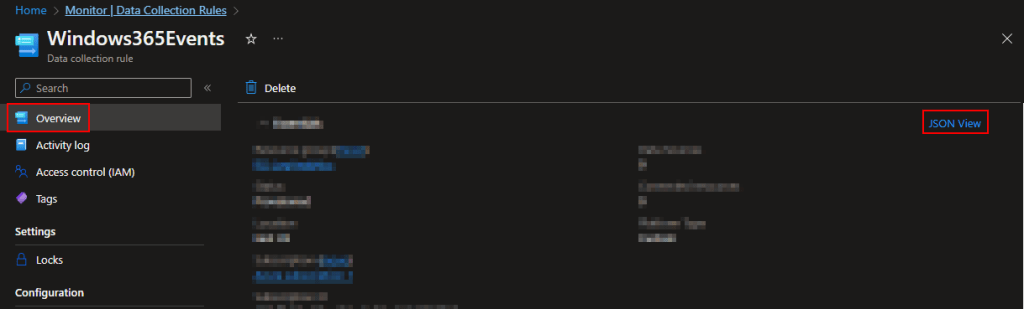
Inside the JSON view, grab the immutableId and notate its value for both tables.
Now, head back into Visual Studio Code.
- For both scripts, change $WriteLogFile back to $False.
- Turn $Delay to $False, you can see this or just read the script comments to know what this does.
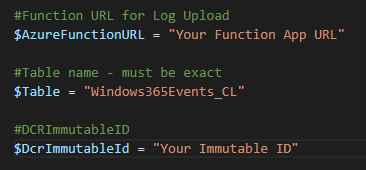
- Into $DcrImmutableId (or rather the quotes next to it) drop the ID’s we just gathered. Obviously, the event DCR ID goes in the Event Collector Script and app DCR ID into the App collector script.
- lastly, fill in $AzureFunctionURL with your Function Apps Function URI with the Default Function key. If you’re not sure where to get this, see the “Getting the Function App URI” section here. Effectively, go into the Function App, click Functions on the left, Click the DCRLogIngestAPI function, and Get Function URI at the top, and get the Default (Function Key) URI.
One last thing before we execute them. Go to C:\Windows\LogAnalytics (this exists now and is hidden) and delete the windows365EventCollector.txt file inside it. That text file will exist assuming you’re now running these on the same station used to generate sample data. This is the marker file used to determine event collection ranges. If we had left it, the station would have only collected events from the time in that marker file when we generated sample data to now. by deleting it, it will think it’s a first run again and pull a full 7 days (by default) back in time and upload it.
You should then be able to run the scripts with F5 and they should both report back something like…
InventoryDate:27-03 18:42 AppInventory:OK @{LogName=Win365AppInventory; Response=204: Upload payload size is 2.6Kb}
Output: InventoryDate:27-03 18:42 Windows365Events:OK *** Response: @{LogName=Windows365Events; Response=204: Upload payload size is 25.6Kb} *** Number of logs found: 21
Note: If you do not get a success status, see this article here for troubleshooting. The information in that article is primarily for the learning series but the same concepts apply. Odds are it’s a permission issue.
Once you get a success status, it’s time to move on to validating that data arrived.
6: Validating Data Arrival
It may take up to 10 minutes for the new data to populate your workbooks but, you should then be able to go into Log Analytics, choose logs on the left, and view the records uploaded into your new tables. For example, here is my initial ingestion into the Windows365Apps_CL table.
Again, yours should say ScriptVersion 2, not 1 as shown below.

If your tables don’t have any data, try waiting and clearing cache. These menus are strange with updating when it comes to first receiving data to new tables or columns. If it goes over half an hour, the first thing I would suspect assuming you got a success message is that your DCR IDs were backwards between the two scripts.
Conclusion:
While I was hoping to cover the whole setup at once, I think this post is now easily long enough. I will save the workbook creation, alteration, script control details, and deployment for the next part. For now, you should have your DCRs and tables created, and some initial data ingested!
The Next Steps:
See the index page for all new updates!
Log Analytics Index – Getting the Most Out of Azure (azuretothemax.net)
I will be putting the Win365 guides on the Log Analytics Index page under their own section.
Disclaimer:
The following is the disclaimer that applies to all scripts, functions, one-liners, setup examples, documentation, etc. This disclaimer supersedes any disclaimer included in any script, function, one-liner, article, post, etc.
You running this script/function or following the setup example(s) means you will not blame the author(s) if this breaks your stuff. This script/function/setup-example is provided AS IS without warranty of any kind. Author(s) disclaim all implied warranties including, without limitation, any implied warranties of merchantability or of fitness for a particular purpose. The entire risk arising out of the use or performance of the sample scripts and documentation remains with you. In no event shall author(s) be held liable for any damages whatsoever (including, without limitation, damages for loss of business profits, business interruption, loss of business information, or other pecuniary loss) arising out of the use of or inability to use the script or documentation. Neither this script/function/example/documentation, nor any part of it other than those parts that are explicitly copied from others, may be republished without author(s) express written permission. Author(s) retain the right to alter this disclaimer at any time.
It is entirely up to you and/or your business to understand and evaluate the full direct and indirect consequences of using one of these examples or following this documentation.
The latest version of this disclaimer can be found at: https://azuretothemax.net/disclaimer/
