Introduction:
Following my Log Analytics Learning Series V2, this three-part series will provide you with the resources and information to guide you through the setup of Log Analytics for monitoring a Microsoft Windows 365 (Cloud PC) environment. A big shout out to some friends on the Windows 365 team at Microsoft for helping determine what values would be good to monitor.
Just like the V2 version of the learning series, this V2 Series is a revamped version of the original Windows 365 series with the improved authentication baked in. If you have already deployed the original Windows 365 collector, you will need to deploy the new updated Function App, grant it the needed permissions, and deploy the new collector. You can re-use the same Log Analytics workspace and tables, and even have data coming into the tables from both Functions at the same time for a smooth/staggered cut-over.
In this section we will cover…
- Prior Knowledge Requirement
- What does this tool provide?
- RDP Disconnect Tracking
- TCP/UDP Connection Info
- Machine Uptime
- Application Version Tracking
- Ingestion Information
- Query Filtering
- Cost Monitoring
- Cost Predictions
- Custom creations
- Q&A
- Credit
- Conclusion
Prior Knowledge Requirement:
This series of guides builds on the information provided in my Log Analytics learning series V2. While that series used a generic and basic collection script for the sake of learning how this all works, this series will provide you with a fully-fledged collection script and workbook to go along with it.
Much of the concepts, ideas, terminology, and components carry over entirely from the learning series. For this reason, I will not be covering those items in depth as part of this series. Instead, I will expect readers to already have that knowledge or, I will link back to the learning series as needed. Linking back will be primarily for the setup components rather than pure knowledge sections. Expect those links to be mainly in the next article in this series which covers actual setup.
That said, while you don’t need in depth knowledge of how this works under the hood to understand this initial article and the powerful data this tool provides, I would highly recommend entirely following the learning series before attempting to deploy this. That way, you will have 80% of the item’s setup already and, you will better understand what is actually happening and the costs behind what is being done, rather than just clicking the buttons I say to.
What does this tool provide?
Let’s get right to the meat and potatoes. What does this achieve?
In short, this Log Analytics collector will pull a variety of Windows 365 specific information from your Windows 365 machines. It will then compile it into Log Analytics in a human friendly manner for both viewing and exporting. Below is a brief summary of the primary data points it collects. We will do a deep dive on each of these.
- RDP Disconnect event tracking for monitoring for outages and/or poor connections.
- TCP/UDP connection tracking for monitoring Shortpath.
- System uptime monitoring.
- Tracking of updates/versions for the following Windows 365 specific apps…
– Microsoft Teams
– Remote Desktop WebRTC Redirector Service
– MsMmrHostMsi
– Remote Desktop Multimedia Redirection Service - Ingestion monitoring for the tables that ingest the above data.
- Cost monitoring for the tables that ingest the above data.
- Cost prediction query’s such that you can prediced a scalled cost for full deployment of this tool.
RDP Disconnect Tracking:
Here is a scenario: Your boss and his boss just got knocked off their Windows 365 PC for a moment – at the same time. They come to you and ask, “Hey, did that effect anyone else?” Where can you find the data to find a concrete answer? This is how.
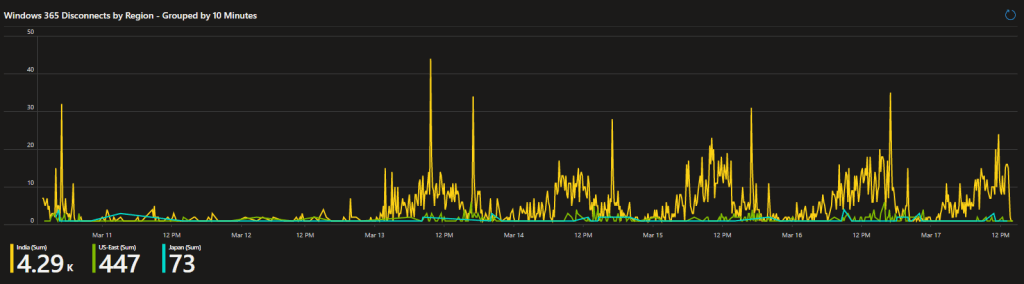
With this tool, you can see a 10-minute group breakdown of all the RDP disconnect events happening within the organization. Not only that, but those events are broken down by the region those devices live in. This way, you can look and at a glance determine when an outage has likely occurred or, what region that effected, or possibly what regions in general seem to be having stability issues.
That is a nice graph, but what about specifics? Don’t worry, that’s covered to.
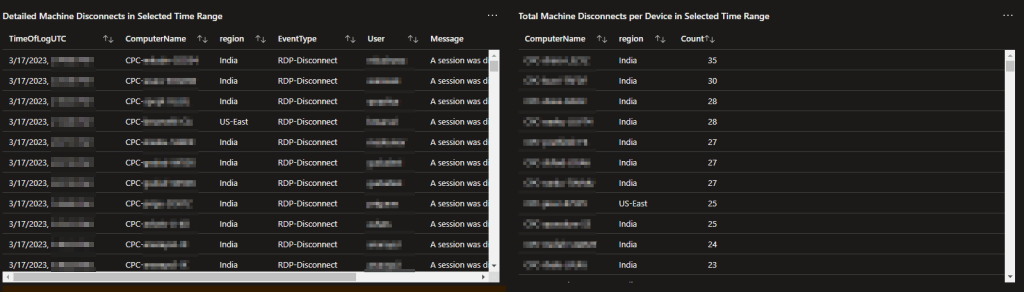
Alongside the chart, (left-side above) you will find a detailed report of every disconnect event listing out the time of the event (in UTC), Computer Name, Region, Event Type, User, and the full event log message.
Additionally, (right-side above) there is a summary by total disconnects per-machine. This way, you can quickly identify outliers who are clearly experiencing an issue somewhere in the chain.
Note: RDP disconnects happen whenever there is an active interactive RDP session and that session breaks – including just hitting the X on the blue bar at the top of the screen. Logging off the machine or rebooting it do not generate these events.
TCP/UDP Connection Info:
If you are using Windows 365 you should definitely be using UDP via the Shortpath solution. If you are not using this, at least from my experience, you can fully expect latency sensitive items (video/audio calls for instance) to be noticeably degraded in quality and consistency as the bandwidth from host to cloud device can be slashed by over 10-fold. If you don’t believe me, send a ticket to the Windows 365 team and ask if you should be using UDP over TCP.
So, how can you know where Shortpath is an is not working? This is how.
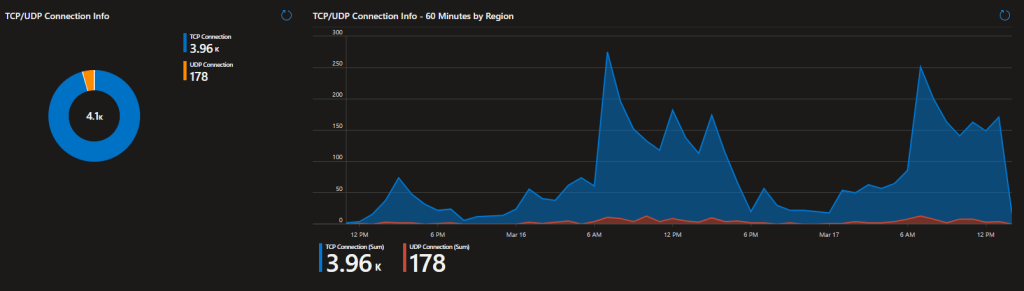
As you can see, this environment clearly is not working properly with Shortpath as 95+% (percentages show when hovering over the pie chart) are coming in via TCP and not UDP.
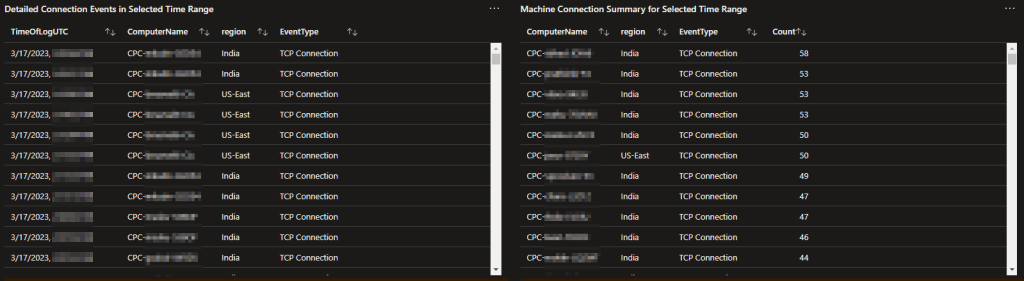
Of course, just like the previous data, there is an individual event breakdown and summary breakdown. This includes both a log for every event on every machine, as well as a summary by count & connection-type by machine.
Machine Uptime:
Related to both the processing of updates and potentially an outage event, the Machine Uptime is another field collected for this workbook.
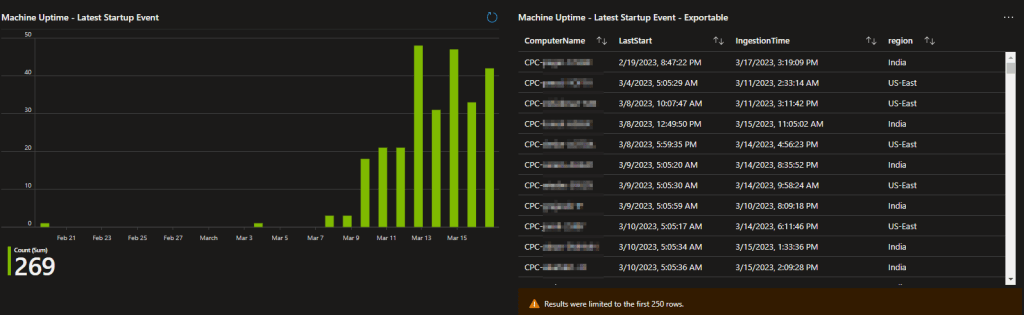
Much like the above items, we have a graph for easy visualization that allows us to quickly identify we have some devices that are not rebooting like they should. On the right, we have a detailed status of the same data giving us a line by line for each station so we can get the details of the problems we spot on the left.
In depth knowledge: This field is a little more complicated than the others in terms of how it is collected. Logging/uploading reboot events themselves would be a problem given the default 30-day datapoint retention in Log Analytics. That would cause machines with over a 30-day uptime to simply fall off the chart. Instead, this calculates the uptime which is typically accurate to within a few seconds of the actual Windows event. The machine then always re-uploads that data-point whenever it has a TCP or RDP event to upload as well. Optionally, it can be configured to upload every time regardless of there being other events to upload although, that would cost more since you would ingest more. Specifics on how to control this will be in the setup section.
Application Version Tracking:
Continuing on, we poll version information for all of the following Windows 365 related apps.
– Microsoft Teams
– Remote Desktop WebRTC Redirector Service
– MsMmrHostMsi
– Remote Desktop Multimedia Redirection Service
Because we pull this information on a regular basis, not only can we produce the current version information, but we can also create historical views to show trends overtime.
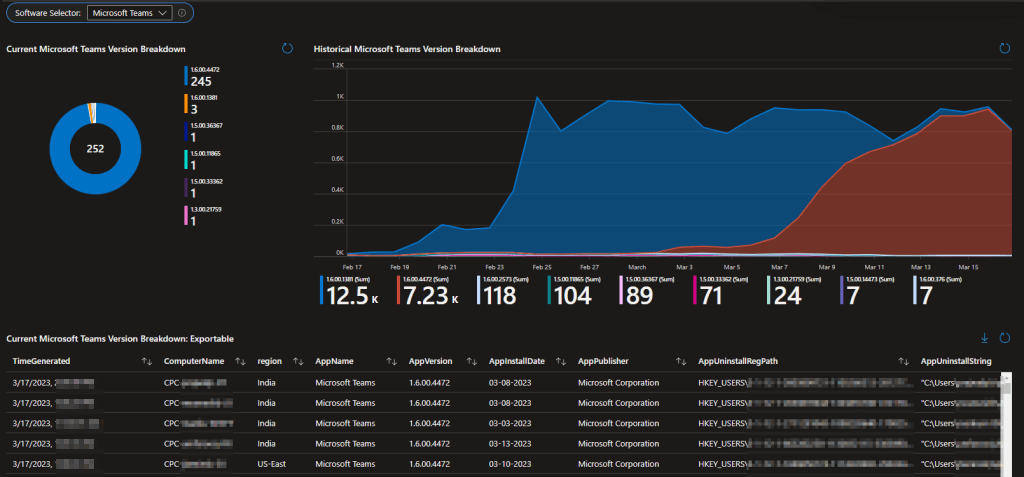
With this, you can see what the current (most recent data per device) breakdown is per app, along with the historical view so you can see updates roll out. Now you know what version is reaching the machines, when it applied to a station, what stations it is and is not on, and can get an exact breakdown of the station and full application details.
Swapping between the four reported apps is controlled via a simple drown down located at the top.
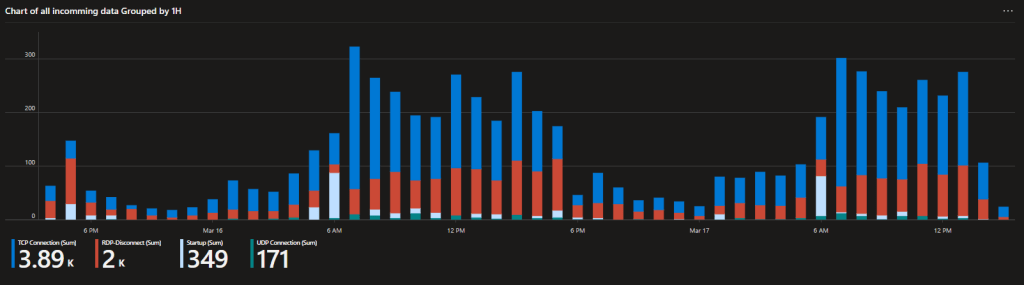
Ingestion Information:
This workbook relies on a pair of tables, both of which come with a tab for monitoring ingestion, both by data point count and the version of the script in use. This helps you monitor that all devices are checking in, as well as with what version of the script was used to send that data. This is primarily used by administrators for monitoring the health of ingestion and update rollouts to the collection script itself.
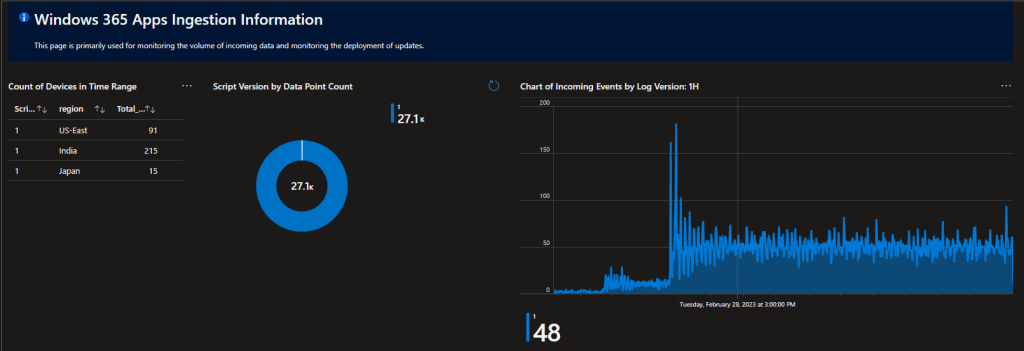
The event table (RDP Disconnect, Startup, TCP/UDP events) also comes with its own breakdown of the kind of events coming in and by what count.
Query Filtering:
You may have noticed how a lot of the queries thus far have information regarding the region of the device. Well guess what, every single query thus far can be filtered by region (all, some, or just one) using a drop down at the top such that you can see a breakdown of said data by said region(s).
For example – Do you want only RDP disconnects in Japan? Worried Team’s is failing to upgrade in US West? Concerned that your new region isn’t working with Shortpath? Well, now you can toggle in and out of certain regions to see what the breakdown is for those regions.
Additionally, all items shown thus far have the ability to have their data limited to a specific time range. Do you want to see only data from the past two weeks, or past 48 hours, and thus only data from devices which have been online and checked in only in that duration? That is easily accomplished via a drop down at the top of the workbook. Or, alternately, you can see a full month’s worth (30 days) of data.
Cost Monitoring:
If you read the learning series (you should), you know I have discussed how this solution is cheap. Well, it comes with a cost monitoring menu. This does require that you know your cost per GB to ingest data to Log Analytics.
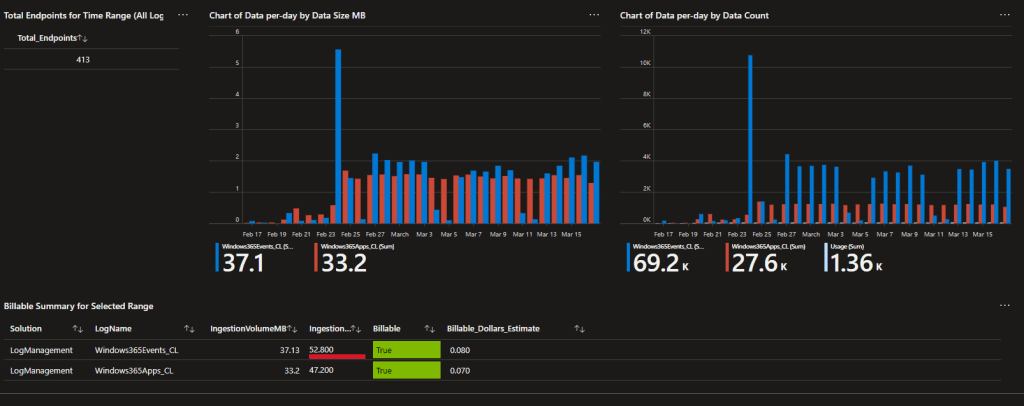
As you can see, so far in the past 30 days 400+ devices have managed to rack up a grant total of… $0.15 worth of ingestion fees. These queries only monitor ingestion fees though! If you don’t know what that means, that’s why you should read the generic serries such as the cost section.
In depth knowledge: If you are wondering about the huge spike at the start of the event collector, that’s because the event collector initially runs back 7 days of events (or however much you want) and then only collects new events going forward. So, you see an initial run spike as it pulls days’ worth of data all at once. That then levels out as it pulls only the new events since that initial pull.
Cost Prediction:
As discussed in the very last part of my educational series, this is the wonderful and automatic cost prediction tool. This allows you to run the collection on a small set of sample devices, then scale up the cost to an organization wide deployment. You do need to plug in your regions cost per GB way up at the top, as well as the organization size you want to scale up to. In the end, you get something like this…
Note: This is running off a solid 7 days’ worth of data from a total of 308 devices so, consider this a real scale up for US East which is currently at $2.30/GB.
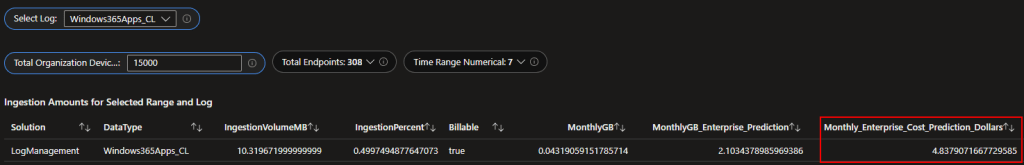
As you can see, to scale the App collector portion out to 15,000 devices would have a predicted cost of… $4.83 per month – TOTAL. So, when my friends with Microsoft commented on how this is practically free, now you know why.
For those who are curious, the event collector portion would be another $5.52 per month at again 15,000 devices.
Again, this is ONLY Ingestion cost. There are more sources of cost behind this but, you basically have to do something very wrong to make this solution not (relative to organization size) “cheap.”
Custom creations:
Of course, you can always make your own queries, alter the collector as need be, and view raw logs in the query creator. What I am providing is a starting point, feel free to change it how you wish.
Q&A:
Truth be told, I don’t have many of these yet and many of the ones I listed below are answered in the learning series. Still, I thought these important enough to cover here.
Q: How live is this data?
A: Obviously, if the goal is to track an outage, you want relatively live data. Unfortunately, the fastest you can run a collector currently via Intune Proactive Remediations is hourly. So, depending on timing, the data could be up to an hour delayed from when it occurred. However, the reality is that you should run your collectors with the random delay function enabled meaning that they will be up to 110 minutes delayed instead of 60. Again, that is an up to, not an always. If an event happens, the collector happens to run 5 seconds later, and the random delay is another 5 seconds, your data will reach you in 10 seconds. You will still see obvious spikes in the data forming, it will just be up to 110 minutes before you can safely conclude all data has now arrived.
For example: If all 10,000 people in the company get kicked off their Cloud PC at the same time, statistically you will average around 25% of those disconnects being reported into the system after about 30 minutes (25% of 110 minutes) and that should be more than enough to know something happened.
Q: I am seeing disconnect spikes, but nobody is reporting an outage. What is happening?
A: As you can see in my sample chart, one of the regions is spiking daily in the mid-afternoon. That’s 5 PM EST and everyone logging off for the day. Again, the Windows Events we use to track this make no indication of the event being purposeful (the employee hitting the X on the blue RDP bar) or otherwise. You just know an active session ended and wasn’t a logoff / restart.
Q: How safe is this solution?
A: This is a tricky question, but I know it’s something a lot of folks wonder about. I could easily write a 5-paragraph answer here explaining this but, the truth is the answer has already been written a few times over. What you need to do is review the information in the learning series and supporting articles, then make a decision on your own as to if it’s safe enough for your organization. As always, see the disclaimer at the bottom.
In short, the new Version 2 of this solution is much safer as the authentication mechanism for uploading logs has been much improved. You can find the most detailed information on this in the Overview and Function App articles.
Credit:
Credit where credit is due, I do want to note that the concepts of this Function App and client-side script are based on the Intune Enhanced Inventory project by @JankeSkanke with the MSEndpointMgr team. For specifics of the Function App credit, please see part one of the learning series. Regarding the client-side script provided in this series, their work in collecting a list of installed applications on a machine was used to create the section that pulls installed apps in this client-side script.
Conclusion:
You should now have an idea of what this collector can give you, and the value it provides. In the next part we will be looking at how one actually deploys it.
The Next Steps:
See the index page for all new updates!
Log Analytics Index – Getting the Most Out of Azure (azuretothemax.net)
I will be putting the Win365 guides on the Log Analytics Index page under the learning series.
Disclaimer:
The following is the disclaimer that applies to all scripts, functions, one-liners, setup examples, documentation, etc. This disclaimer supersedes any disclaimer included in any script, function, one-liner, article, post, etc.
You running this script/function or following the setup example(s) means you will not blame the author(s) if this breaks your stuff. This script/function/setup-example is provided AS IS without warranty of any kind. Author(s) disclaim all implied warranties including, without limitation, any implied warranties of merchantability or of fitness for a particular purpose. The entire risk arising out of the use or performance of the sample scripts and documentation remains with you. In no event shall author(s) be held liable for any damages whatsoever (including, without limitation, damages for loss of business profits, business interruption, loss of business information, or other pecuniary loss) arising out of the use of or inability to use the script or documentation. Neither this script/function/example/documentation, nor any part of it other than those parts that are explicitly copied from others, may be republished without author(s) express written permission. Author(s) retain the right to alter this disclaimer at any time.
It is entirely up to you and/or your business to understand and evaluate the full direct and indirect consequences of using one of these examples or following this documentation.
The latest version of this disclaimer can be found at: https://azuretothemax.net/disclaimer/
