Introduction:
With your data ingesting and workbooks deployed, we are now ready to start deploying the collector via Proactive Remediations in Intune.
This will likely be the final article in this series, at least for now.
In this section, we will cover…
- Requirements
- Recommendations
- Preparing the Collection Script
- Pushing the Script via Proactive Remediations
- A Tangent on Cost and Run Frequency
- Back to the Deployment
- Conclusion
Requirements:
This should be pretty obvious, but you need to have completed the setup article covering the setup and initial data ingestion, as well as gotten data to successfully show inside the tables (step 6). Additionally, you should have your workbooks all set up so you can monitor data as it comes in. If you haven’t gotten that far, you should not be deploying these yet.
As mentioned a few times before now, you need the appropriate Intune Proactive Remediation compliant licensing.
IMPORTANTLY: Keep in mind that any group you want to scope this collector to also needs to have had the policy we created scoped to it as well! The policy should be scoped BEFORE the collector!
Recommendations:
As I started to write this, I realized I had a few important notes and ultimately decided it made more sense to group these up here instead.
1: While you could technically follow these steps to scope the collectors straight to All Devices right off the bat – Please don’t. Please do scope to a test group first. What’s nice about that is you can monitor your ingestion MB, calculate the price if you know your region cost, and do the math of what it costs to scale to a larger group. I tend to do deployment groups of 1%, 10%, 100%.
For those wanting to better understand how to get those cost numbers and do that rollout prediction math, see the below article. It’s worth noting that I have workbooks to automate this process, and I do plan to provide them.
PowerShell DCR Log Analytics: Part 2.12 – Ongoing Cost Monitoring and Predictions
2: For those who run into trouble with this article, there is a section of my Learning Series that covers this process in depth. See below.
PowerShell DCR Log Analytics: Part 2.7 – Deploying Data Collection Scripts
Preparing the Collection Script:
Before we can deploy the script via Proactive Remediations, we need to take the script you have been manually running to manually send data and make one minor tweak.
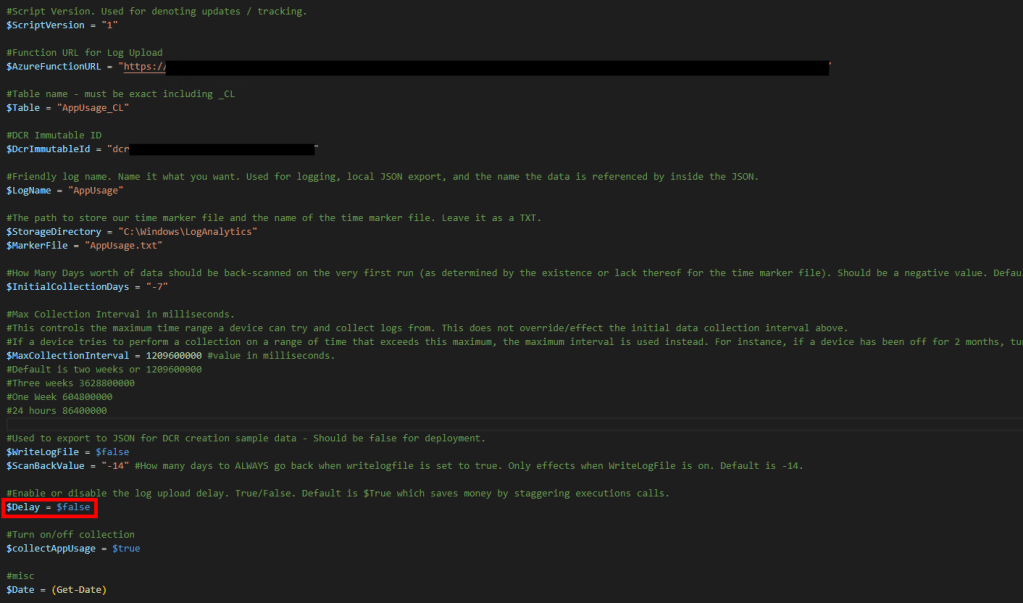
In the Variables Region, locate $Delay and change it from $False back to $True. If you are wondering what $Delay is and does, see the section “What is $Delay” here.
The final deployment-ready Variables section should look like the one below.
Pushing the Script via Proactive Remediations:
Warning: Microsoft loves to move all these menus around and change how they look. I try to keep the learning series in line with their changes and as such, if you run into issues like missing menus, look for the generic version of this process in the learning series.
First, head into Intune.
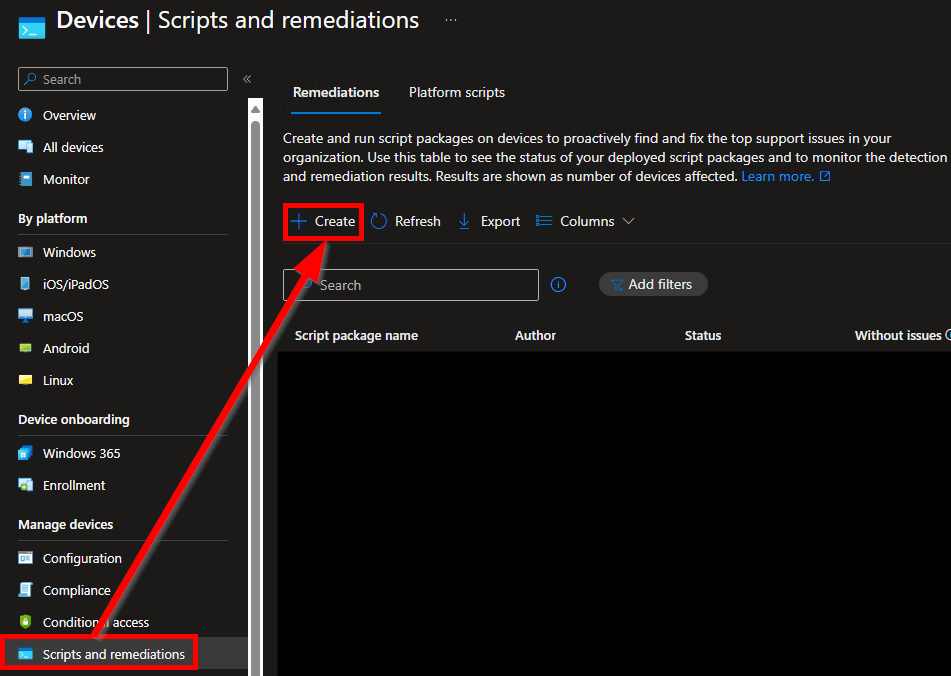
As of early 2024, the PR menu is now located under Devices, Scripts and Remediations. Then. choose Create Script Package. See below.
Note: You may need to confirm your tenant licensing if the option is greyed out like. See the learning series here for details.
You will then be prompted for a multitude of values. These are the only ones you need to set/change.
- Detection Script File.
This is the data collection script, just browse out to wherever you have saved it. - Run Script in 64-bit PowerShell
Change this to yes. Without it, you can’t query 64-bit registry locations properly.
We don’t need a remediation script for this, nor do we want to run as user (we want to run as System). Script Signature Check is something you will have to investigate on your own and make your own determination.
When the information has been entered which should look like the below, hit Next.

If you use Scope Tags, feel free to add them. When done, hit Next.
For groups, you need to select either a user group or a device group. I have several notes on this topic.
- Know that if you select a user group, it runs on any device that the user logs into, not devices they explicitly own (primary user) and not devices they aren’t logged into actively (from my experience).
- Additionally, if you scope to a user/device group, you can (or should) only exclude a matching group. Don’t scope to devices and try to exclude users.
- Given these are data collection scripts, I would highly recommend scoping to DEVICES as we need these scripts to run regardless of a logged-in user’s presence. I would also again recommend you use a small test group and slowly roll these out.
You can deploy to all devices using the upper drop-down Selected Groups box or pick individual groups using the Select Groups to Include hyperlink.
All Devices:
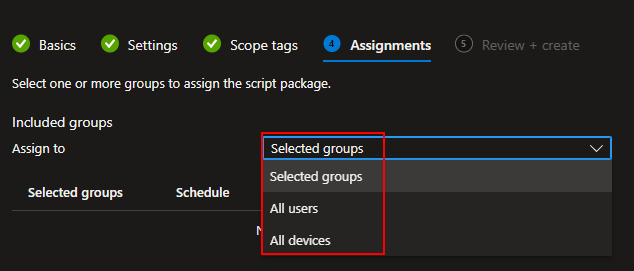
Selected Groups:

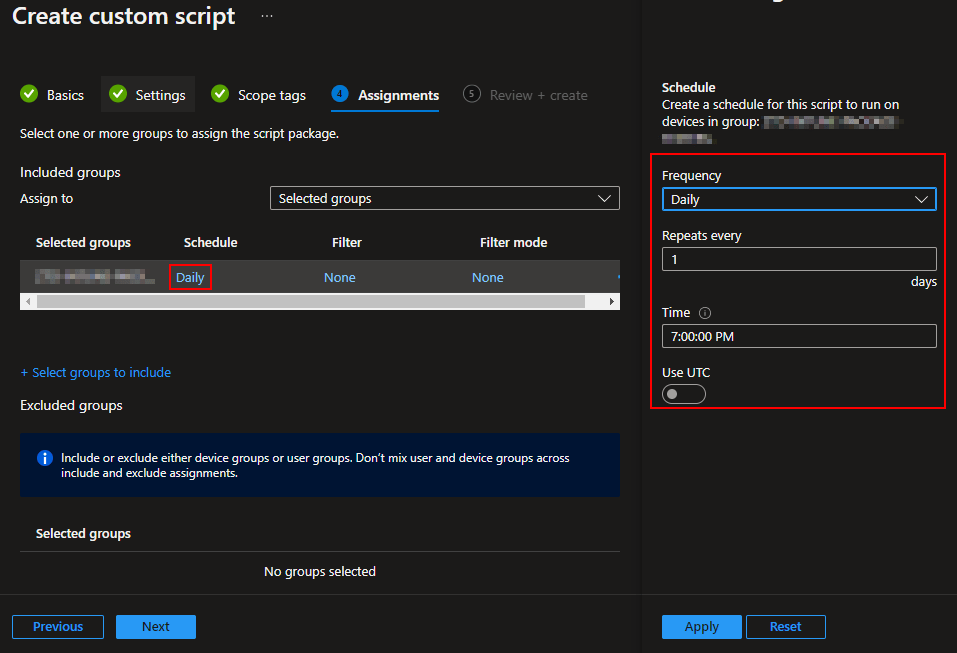
Once a group is selected, you can then alter the schedule for that group. You can put different groups on different schedules. I really would not advise having different schedules depending on group for the same singular collector deployment though, it makes understanding/explaining how live data is very difficult.
A Tangent on Cost and Run Frequency:
You may be asking yourself how often you should run these scripts. As I mentioned in the cost section, you should run it every hour. That means, given devices are online, data is at most 110 minutes (1 hour + 50 minutes due to $delay) behind “live.” Running this collector hourly does NOT increase ingestion cost as this is an event-based collection script.
From the cost article:
Specifically regarding run frequency, in previous collectors like the Windows Endpoint set which collects a relatively static and common data set on each run, I talked about how running the collectors more often made a very linear cost increase. That is not the case here. This is an event collector; it only collects whatever new events there are to collect since it last ran. Whether you pay to ingest that in 4 incremental sets over the next 4 hours (running once an hour) or collect it all at once in 4 hours (running every 4 hours), makes no difference to ingestion cost. That’s because either way you ingest the same amount of data. The good news is that running it more frequently makes your data more up to date but, the bad news is that it does affect Function App executions cost as you are more likely to call it more often.
Back to the Deployment:
Once you have your groups and schedules figured out, you can go ahead and hit Next and Create.
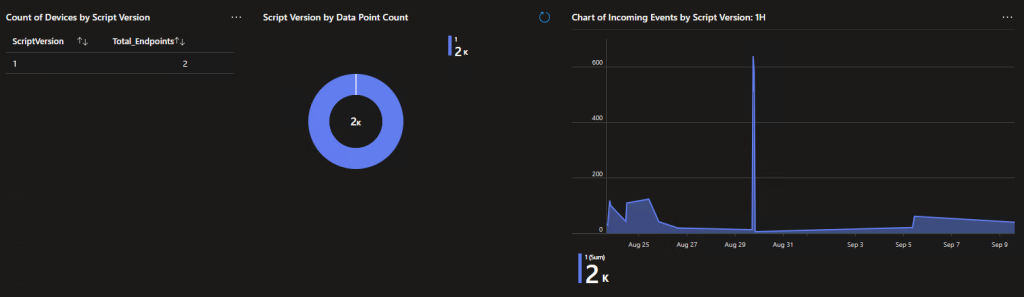
You can then use the handy-dandy Ingestion Information page (example below) in the workbook to monitor how many devices are sending in data, how much data they are sending, etc. This should make a nice upward trend as more and more devices pick up the assignment and begin their schedule.
That said, I have found that the deployment of Proactive Remediations is PAINFULLY slow. Even if you tell it to run hourly and scope to thousands of devices, I would expect only 10% of your scoped population to have checked in within 3 hours.
So, if you scoped to 30 devices on an hourly schedule, 3 hours later you might have 3 new devices in the log. If you scoped to 10,000 devices on an hourly schedule, 3 hours later you might have only 1,000 devices.
All in all – these are just not fast to go out.
Conclusion:
Given some time, you should have some new devices sending in data. Let it run for at least a week, do the scaling math, roll it out to the next group, and so on down the line until you are out to 100%.
This does conclude my planned segments of this series – thank you for your interest and happy data mining!
The Next Steps:
Again, this is the final planned article in this series, but I am sure I am not quite done with Log Analytics!
See the index page for all new updates!
Log Analytics Index – Getting the Most Out of Azure (azuretothemax.net)
Disclaimer:
The following is the disclaimer that applies to all scripts, functions, one-liners, setup examples, documentation, etc. This disclaimer supersedes any disclaimer included in any script, function, one-liner, article, post, etc.
You running this script/function or following the setup example(s) means you will not blame the author(s) if this breaks your stuff. This script/function/setup-example is provided AS IS without warranty of any kind. Author(s) disclaim all implied warranties including, without limitation, any implied warranties of merchantability or of fitness for a particular purpose. The entire risk arising out of the use or performance of the sample scripts and documentation remains with you. In no event shall author(s) be held liable for any damages whatsoever (including, without limitation, damages for loss of business profits, business interruption, loss of business information, or other pecuniary loss) arising out of the use of or inability to use the script or documentation. Neither this script/function/example/documentation, nor any part of it other than those parts that are explicitly copied from others, may be republished without author(s) express written permission. Author(s) retain the right to alter this disclaimer at any time.
It is entirely up to you and/or your business to understand and evaluate the full direct and indirect consequences of using one of these examples or following this documentation.
The latest version of this disclaimer can be found at: https://azuretothemax.net/disclaimer/
