Introduction:
Following my initial articles describing what is collected, how it is displayed, and the quirks that the collector has, this article will cover the cost of this solution.
Before we start, please know that I am no Azure cost “expert.” I can point you in the right direction and provide examples, but you need to consult with Microsoft and your internal Azure teams for all billing questions and estimates. As always, see the disclaimer.
In this section, we will cover…
- The Purpose of this Article
- Prior Knowledge Requirement
- The cost of System Usage & Authentication Monitoring
- Cost Accuracy, and What about Total Cost?
- Conclusion
- The Next Steps
The Purpose of this Article:
In this article, I will primarily be discussing the Log Analytics Ingestion costs of the collector. While I do have something to say regarding the Function App cost (execution costs) it’s mainly a discussion around why that question is difficult to answer. The cost numbers I will be providing are for the US-East region which currently has a $2.30/GB charge for Analytics Logs Ingestion. The numbers I will provide will come from a prediction Workbook further explained in the below two articles. You can also find information on checking your region’s $/GB in the below articles.
This whole article is regarding cost and cost predictions: PowerShell DCR Log Analytics: Part 2.12 – Ongoing Cost Monitoring and Predictions – Getting the Most Out of Azure (azuretothemax.net)
See “Cost Prediction” in: PowerShell DCR Log Analytics for Windows 365 Monitoring Part 2.1: Overview – Getting the Most Out of Azure (azuretothemax.net)
That all said, I will NOT be doing an in-depth explanation of the terminology & concepts in play here which brings us nicely to…
Prior Knowledge Requirement:
While my intro articles had a relatively low prior knowledge requirement as it doesn’t take much to understand what a graph is showing, this article does not benefit from such a low bar. There will be terminology and concepts in play that I will not be explaining as that information has already been written out in detail here: PowerShell DCR Log Analytics: Part 2.2 – Cost – Getting the Most Out of Azure (azuretothemax.net)
Again, if you haven’t followed the learning series, I highly advise that you do so before getting too in-depth on this series.
The cost of System Usage & Authentication Monitoring:
Warning – there are some serious caveats to the numbers I am about to share. Obviously, they will be explained, but it makes more sense to share the numbers first.
So, how much does it cost to collect this? I really hope you read the above linked articles otherwise what I am about to say will sound like black magic. Thanks to my monitoring and prediction workbooks, this is a really easy question to answer. I will do a bit more explaining to help make sure folks stay on the same page.
This collector*(1) has been running on an every-hour schedule, on over 6,000 endpoints, and we will use the full last 30 days of that for our calculations. That’s as good as a sample for making predictions will get.
In total, the past 30 days of ingested data from the above (all 6,000+ devices running every hour) is only 1,988.5 MB – or $4.47. That’s roughly $0.000745 per device, per month. In other words, cheap.
Ingestion costs are linear*(3) so, average the amount of MB per device over the past 30 days, then multiply that up to 25,000 devices, and this would cost about $18.30 for 25,000 devices per month. On that scale, things are more complicated in other aspects. For instance, you might need multiple Function Apps. The point here is that this data is not expensive as far as ingestion.
Now about those caveats…
- The example data I have here is not from running this collector exactly. Mainly, the one I have sample data from does NOT collect event 4625 for Logon Failures which I know is going to be on the larger side of event counts. That said, let’s say at worst it gets doubled… oh no, it costs $36.60 for 25,000 devices… That’s still cheap.
- That said – FILTERING IS KEY. Unlike my Windows Endpoint series, event collection is not a relatively static and common amount of data between organizations.
For example: If you have some service account of some sort, whatever application and use case it may be, and it’s constantly authenticating to thousands and thousands of devices all the time – and you don’t add that account to be excluded from the event collection – your costs will be wildly different. You need to do your due diligence and adjust the event filters to ignore whatever bloat and garbage your particular environment has. Failure to do so is the difference between this solution being inexpensive, and this solution being just as poor and expensive as the Microsoft “collect all” solutions.
That said, if there is some bloat you do want to collect, then obviously that’s going to swing your prices. - Specifically regarding run frequency, in previous collectors like the Windows Endpoint set which collects a relatively static and common data set on each run, I talked about how running the collectors more often made a very linear cost increase. That is not the case here. This is an event collector; it only collects whatever new events there are to collect since it last ran. Whether you pay to ingest that in 4 incremental sets over the next 4 hours (running once an hour) or collect it all at once in 4 hours (running every 4 hours), makes no difference to ingestion cost. That’s because either way you ingest the same amount of data. The good news is that running it more frequently makes your data more up to date but, the bad news is that it does affect Function App executions cost as you are more likely to call it more often.
Cost Accuracy, and What about Total Cost?
These are two questions I asked and answered when I did the Windows Endpoint cost article. I want to repeat them here primarily to showcase the differences an event collector has when it comes to answering these questions.
Are you sure these predictions are accurate?
Truth be told, this is not a yes or no question. The best answer I have to that question is an explanation.
The workbook I use to monitor and predict costs shows a past 30-day ingestion cost of $105.46 for all my tables, including others beyond what is being covered here. Azure itself shows a cost of $105.06. I can tell you that the slight variance is because the Log Analytics cost is exactly-now through exactly-now-30-days-ago. Meaning, if I look at the cost at 4 PM, it’s showing the cost of 4 PM today through 4 PM 30 days ago. Whereas cost analysis uses now (4 PM in my example) through the start (midnight) of whatever day was 30 days ago. So, Cost Analytics is seeing an extra 16 hours of ingestion in this example that Log Analytics can’t. Hence a little extra cost shows up.
Back to my point though, we can see that the workbook does understand how many MBs are coming in and can then easily do the math to figure out the cost of that in my region. The workbook also can see how many individual devices are reporting into a given table. From that, it can find the average MB a single device is sending in. That average multiplied by how many devices you have is how we make our prediction.
The good news is that predicting scale-up costs is effectively a linear calculation.* If you’re going to double the amount of devices reporting in data, it will cost twice as much to ingest. That said, that calculation is reliant on good sample data giving you a good average MB per device. Again, if for some reason every machine in your environment has 3 accounts constantly authenticating over the network for your antivirus solution or SCCM solution, something totally unlike the 6,000+ devices used to make the sample data that provided the predictions here, your numbers will be different. At the end of the day, these numbers are the most accurate prediction numbers I can provide, and that’s as good as it’s going to get.
*I should say for event collection, it’s linear within your environment. Odds are the average cost of a device derived from sampling 10% of your organization is very close to the average cost per device when sampling 100% of the organization. That does not mean that prediction smoothly moves from environment to environment, at least not without adjustment to the script’s filtering.
What about the total cost including the Function App?
I have a singular Function App in my environment. It’s hit by roughly 150,000 calls every 24 hours. When we discussed Windows Endpoint cost, I was able to very easily determine how many of those calls were from the device inventory set because I knew how many devices I was running it on, how often the collector was running, etc. This is not the case here.
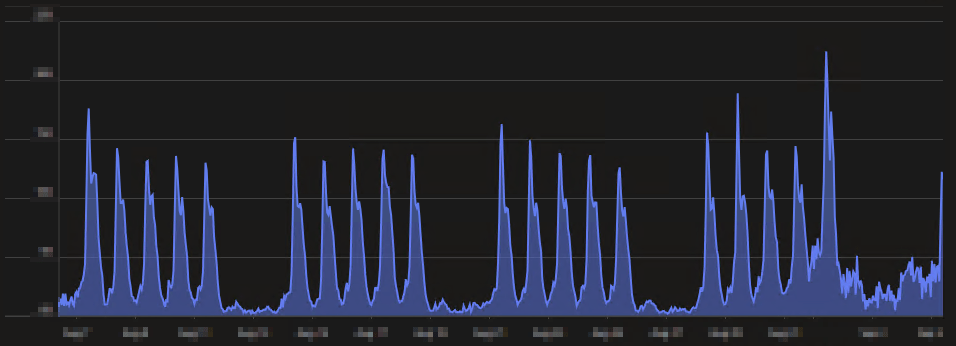
I know how many devices I am running this collector on. I know at most it can call the function app once per execution. However, I can’t say for a fact that it is calling once per hour as it only calls when there are events to upload. It’s very likely overnight or on weekends that volume goes down. I can see that the number of events coming in over weekends and off hours goes down through the aforementioned hourly graphs however, this shows the count of events coming in, not the count of function app executions being made. For clarity, one Function App call could upload 100 events. Try as I might, I just can’t seem to find a way to calculate how many calls likely belong to this collector.
That said, I can tell you the totals of running this Function App for everything, and I think that makes it pretty clear it’s not insanely expensive.
In the past 30 days, the App Service Plan (effectively the Function App) has cost $37.54, and the storage account for the Function App is another $12.09, bringing our total to $49.63. Truthfully, even if I knew the percentage of calls likely belonging to this collector, we could NOT conclude that that means X cost belongs to this collector. This is because, unlike ingestion costs, Function Apps are a pain to predict. You get a certain number of executions for free each month, part of the cost is from execution time, part is from memory, part is from bandwidth. At the end of the day though, I think this number will still give you confidence this isn’t likely to break the bank. For more information, you can see this article.
Conclusion:
Hopefully, now you can see this is a very cost-effective solution. The key is in the filtering. Do your due diligence on your environment to not ingest a bunch of trash.
The Next Steps:
See the index page for all new updates!
Log Analytics Index – Getting the Most Out of Azure (azuretothemax.net)
I will be putting the System Usage guides on the Log Analytics Index page under the Windows Endpoint series.
Disclaimer:
The following is the disclaimer that applies to all scripts, functions, one-liners, setup examples, documentation, etc. This disclaimer supersedes any disclaimer included in any script, function, one-liner, article, post, etc.
You running this script/function or following the setup example(s) means you will not blame the author(s) if this breaks your stuff. This script/function/setup-example is provided AS IS without warranty of any kind. Author(s) disclaim all implied warranties including, without limitation, any implied warranties of merchantability or of fitness for a particular purpose. The entire risk arising out of the use or performance of the sample scripts and documentation remains with you. In no event shall author(s) be held liable for any damages whatsoever (including, without limitation, damages for loss of business profits, business interruption, loss of business information, or other pecuniary loss) arising out of the use of or inability to use the script or documentation. Neither this script/function/example/documentation, nor any part of it other than those parts that are explicitly copied from others, may be republished without author(s) express written permission. Author(s) retain the right to alter this disclaimer at any time.
It is entirely up to you and/or your business to understand and evaluate the full direct and indirect consequences of using one of these examples or following this documentation.
The latest version of this disclaimer can be found at: https://azuretothemax.net/disclaimer/
