Introduction:
Following my initial article in the series, this article will cover an overview of the Application Inventory component of this collector / workbook with a primary focus on what this tool does for you and how the data is visualized in the workbooks.
In this section we will cover…
- Prior Knowledge Requirement Abridged
- Credit where Credit is Due Abridged
- Why not use Intune?
- What does this tool provide? (Further breakdown in this section)
- Technical Improvements
- Q&A
- Conclusion
- The Next Steps
Prior Knowledge Requirement:
I don’t want to repeat this in every article, but it obviously still stands true. If you haven’t seen this section of my initial article, please do.
Credit where Credit is Due:
Again, I don’t want to repeat this in every article, but it obviously still stands true. If you haven’t seen this section of my initial article, please do.
Again, much like the last one, this has been upgraded to both the new DCR based API as well as to the newest certificate-based HTTP(s) Function App authentication mechanisms.
Why not use Intune?
I am sure many folks don’t need to read this section, but for those wondering why they shouldn’t just use Intune for this data, I have a few answers.
Most people know about Apps, Monitor, Discovered Apps in Intune. You can also go to a device and go to Discovered apps. These menus are supposed to show similar data as to what is being discussed here. So why not use them?
1: Reporting Inaccuracies
What you might not know is that these menus don’t function well in that they are not the best at actually detecting apps or being up to date. In other words, the data is incomplete and thus not trustable. Obviously, that’s a lofty claim, allow me to explain.
I had a run in with this back in 2021 when we were trying to use Intune and discovered multiple Microsoft apps like Microsoft office weren’t in the list or took days or weeks to get in it. This resulted in a 6-month long support case before we finally got given the already long-documented answer. Don’t you love it when that happens?
Support Tip: Inconsistencies in reporting of Discovered apps – Microsoft Community Hub
This component is broken enough that Microsoft publicly documented it, let that sink in. And they did so in Fall of 2020. That article was last updated 6/29/21 and is still getting regular comments hoping for news. So, I hope you’re not expecting it to be fixed anytime soon. That said, I did see something recently about improvements to Discovered apps coming out in Q2/Q3 2023, but I am not going to hold my breath that it gets anywhere near this level.
2: Reporting Details
The two Intune menu’s currently show the version of an app and its name. You can export the data and get a little more information like its publisher, but that’s it. Meanwhile, I have the Name, Publisher, Install Date, Uninstall Command, and Uninstall Path. That can all be quite handy to an Endpoint Engineering team, and even has security implications such as knowing when an app showed up.
3: Data Manipulation
With details comes views. KQL will let you arrange and display this data however you want. As I will later detail, I have version breakdowns, pie charts, over time trend tracking, data-point timestamping, etc. You’re just not going to get that from Intune.
4: Data Exporting
Good luck! If you want to get Intune’s data out and into another system, some of it can be pulled via graph, but I have never found online nor has Microsoft support been able to assist in the extraction of these pages. And again, why would you want only partially accurate and slow to update data?
I’ve already written the guides on how to do this with Log Analytics. For those not in the know, the DCR based API lets you push to Event Hubs unlike the old API. Event Hubs can then be pulled from by all sorts of services Like Sumo, and then you can push/pull to other systems from there. See the learning series for more details.
What does this tool provide?
Let’s get right to the meat and potatoes. What does this achieve?
As detailed above, Intune has a lot of reporting shortcomings, and this tool aims to fill in those gaps. This Log Analytics collector will pull a variety of Application Inventory information from your Windows Endpoint machines. It will then compile it into Log Analytics in a human friendly manner for both viewing and exporting. If you want, you can take it to the next level and forward that data to other data warehousing or manipulation solutions.
Below is a brief summary of the primary data points it both collects and displays. We will do a bit of a deep dive on each of these. That said, there is additional collected data which is not currently displayed in the workbook.
NOTE: All of the following screenshots are previews and subject to change! The content will remain the same, but presentation may be altered.
This article only covers Application Inventory, not admin and device!
- All Apps Breakdown
- Searchable Queries!
– Searching for software by name with 4 different breakdowns which we will deep dive
– Searching for software by name on a given machine
– Searching all software on a given machine - An entire page of Office 365 monitoring which we will deep dive
- A page dedicated to Patch my PC
- And an ingestion information page
All Apps Breakdown:
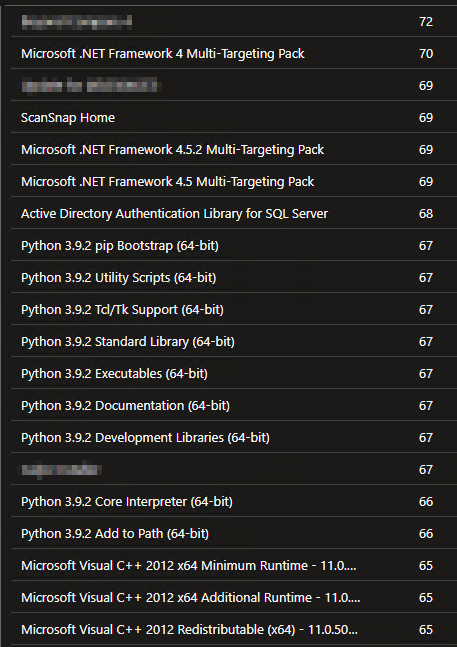
Starting off is our main dashboard. This page stands to answer just one question – what apps are out there, and how many machines does X app exist on? This is achieved via a list breakdown of each AppName and how many devices that app exists on.

In a larger environment, this may look like…

And of course, this gets into the nitty-gritty numbers that might exist on only a handful of machines, or even just one. For larger environments, you will need to export the list using the download arrow in the top right of the query to view the full thing as Log Analytics workbooks have a 250-line limit on the in-browsers viewer.
Software Queries: Patch Monitoring
I don’t know any organization that doesn’t need to monitor patches and their success/failure. This will let you do that in every imaginable way.
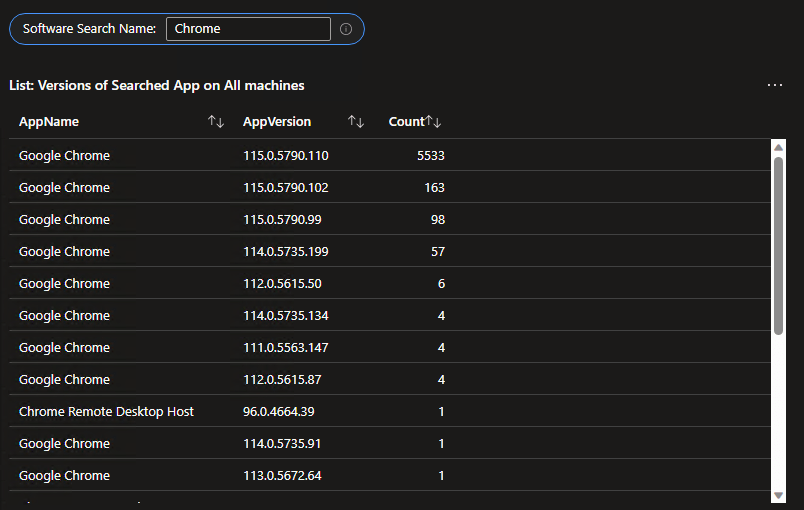
To start, just search for a piece of software. For my example I will use the search “Chrome.”
1: Versions of Searched App on All machines
To start with, your search will return a list of Apps containing your searched phrase. This is broken down by the Apps Name, Version, and the count of that Name/Version present. This immediately gives you a quick rundown of what is out there and, how patched or not patched it is.

In a larger environment this might look like…
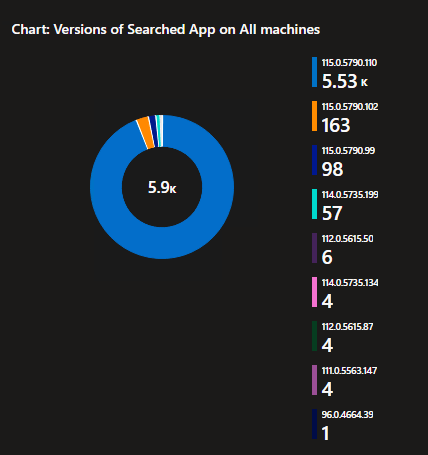
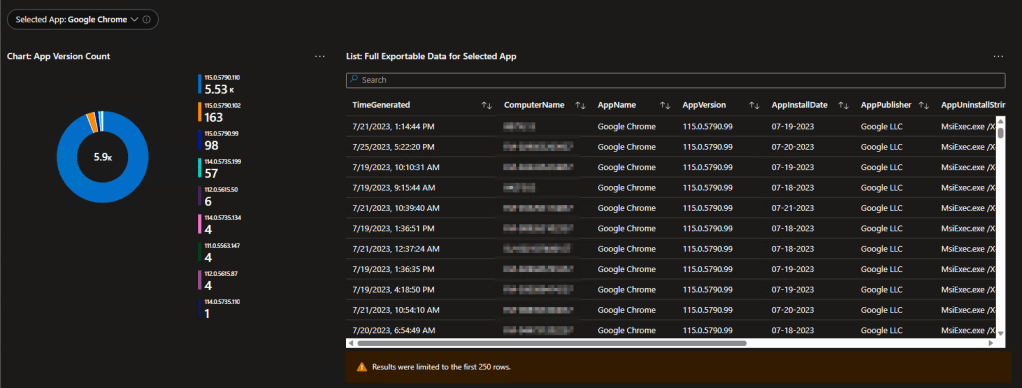
2: Versions of Searched App on All machines
In addition to the above list breakdown, a pie chart breakdown of the same data is also provided for easy and quick visualization and percentage aquisition.
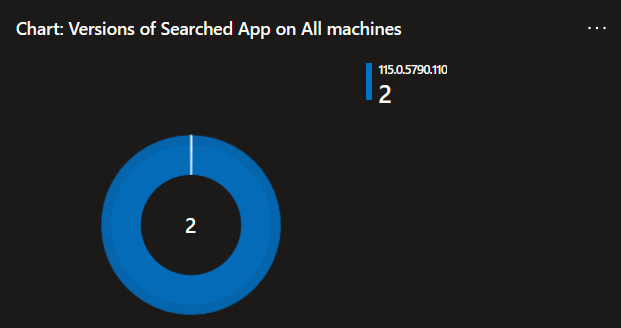
In a larger environment this might look like…
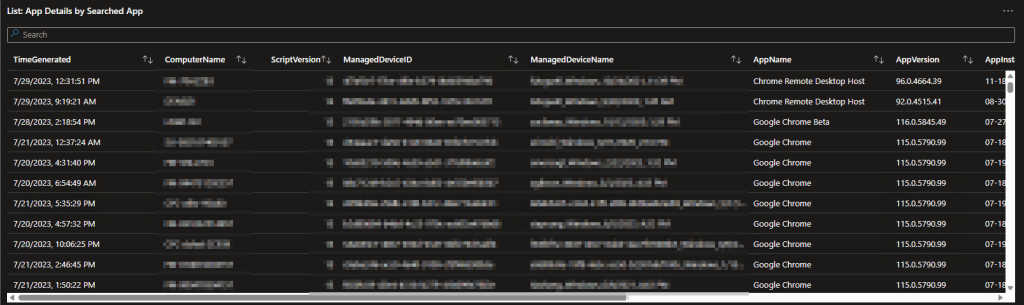
3: App Details by Searched App
Obviously, when you spot a line indicating some devices are way behind, you’re going to want to know who that is. This query provides and exportable table of all the details including the time the data was received, the computer it came from, the version of the script used to provide that data, the Managed Device ID, Managed Device Name, App Name, App Version, App Install Date (if it has one, not all apps do), Publisher, Registry Uninstall Path, and App Uninstall String.
I can’t show the full width of all that data, but this is what that may look like.
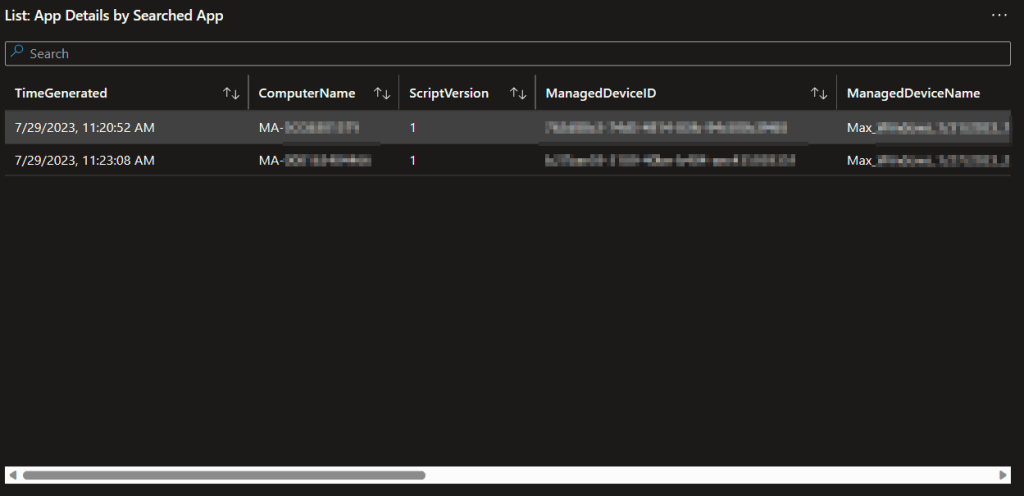
In a larger organiation, this may look like…
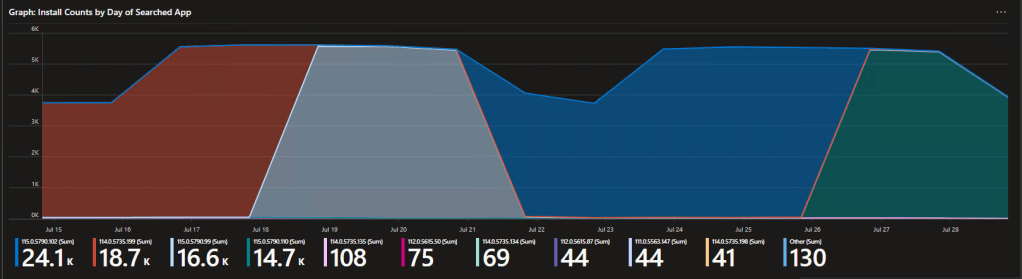
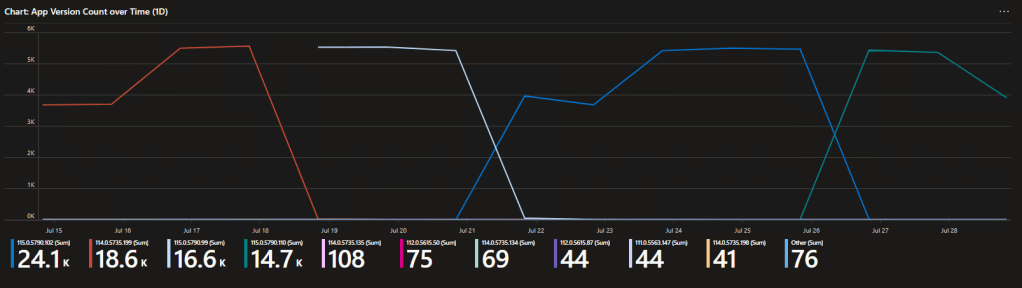
4: Install Counts by Day of Searched App
This is my personal favorite. This is a graph of the install count by version on a day-to-day basis. In other words, this lets you watch the patches go out visually. This is great for both knowing if they are working, as well as to determine when a patch went out. That last bit is especially helpful for quickly answering the question “did a recent patch break this?”
Here we can see Chrome has rolled out 4 recent updates. The color for the old version subsides and the new version takes over. That dip in the middle is a weekend, as not as many devices are online to report in over weekends, thus the total amount of X version seen those days went down.
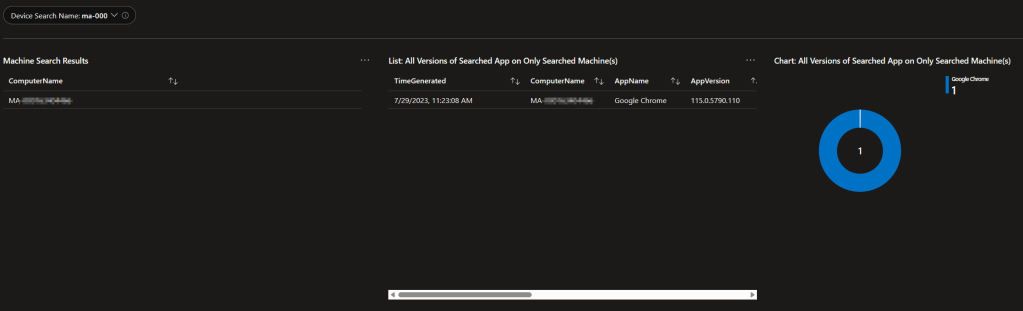
5: Searched app on Specific Machines
This is pretty straightforward. This combines your searched app with a specific machine(s). You can search a single machine to see what version of that searched app is on it, if any, or you can search something like CPC- to see that searched app on only that group. This is great if you use autopilot and set a specific device name standard.
Like before we have a detailed export, a pie chart (mainly useful for when looking at multiple machines), and a search result list (on the left) to let you know what machines your machine search found. This is helpful in case you search a machine that does exist but, a piece of software that machine does not have as this will cause the other queries to return no results.
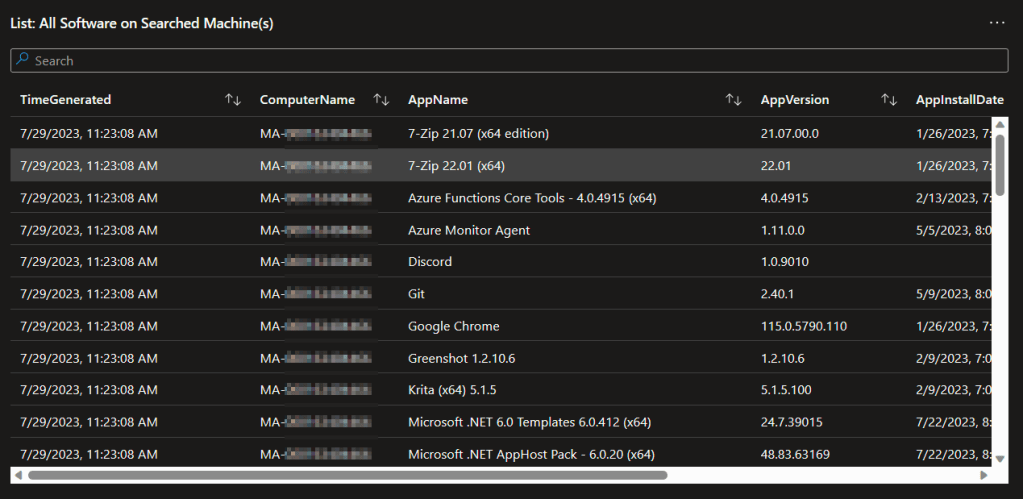
6: All Apps on the Searched Machine
Additionally, we have a query to give you the details of all apps found on that searched machine(s).
Office 365 Monitoring:
Obviously, Office is almost certainly a big component to any organization with Windows Endpoints. Don’t worry, that’s covered to the ends of the earth.
1: General Monitoring
Like the above sections, we have a list and pie chart breakdown to quickly see the versions.

And like the last section, we have a detailed status export as well. Sadly, the office apps don’t note an install date.

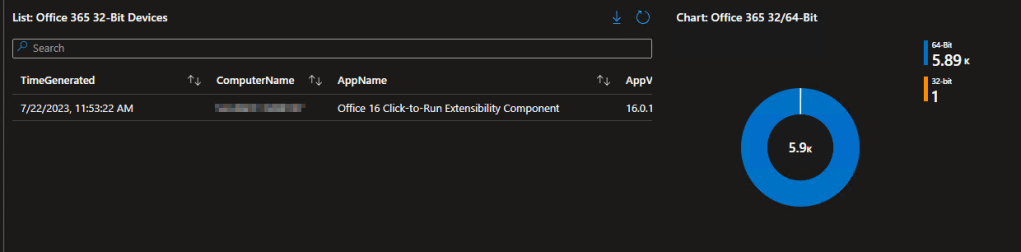
2: 32-Bit Office Monitoring
Most organizations are moving away (or already have moved away) from 32-bit Office. This area both helps locate the few that have been missed, as well as assist in identification for those orgs still in the process of moving.
We have a list of what devices have 32-bit Office, as well as a breakdown in the org of 32 versus 64 bit.
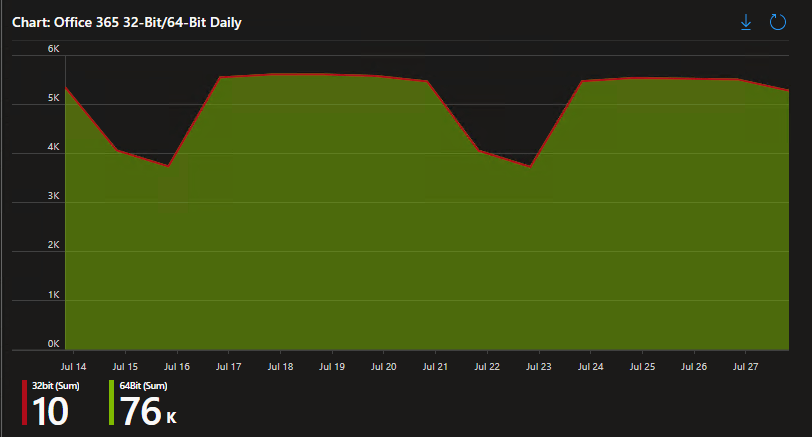
We also have day-to-day trend tracking on 32-bit versus 64-bit which is helpful for monitoring the rollout of a change over from one to the other.
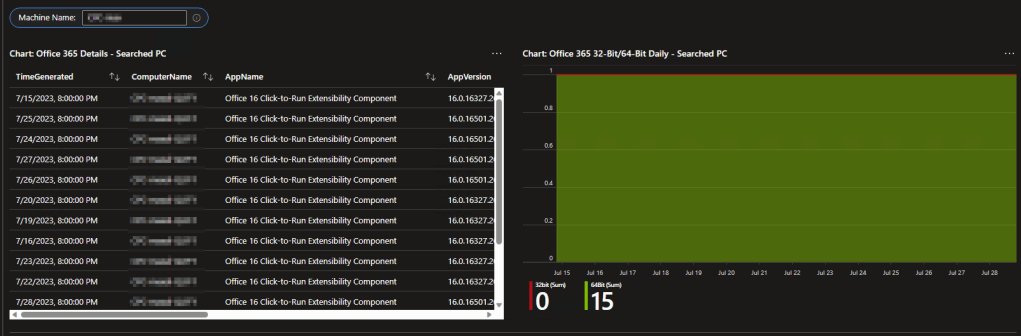
For those interested in the specifics, the 32/64-bit section also has the ability to search a specific machine and pull up all the data points from it, rather than just the most recent, for extra tracking.
3: Teams
Obviously, Teams is a big part of Office to! So, let’s monitor it! Same as before, a list, a pie chart, and a detailed export.

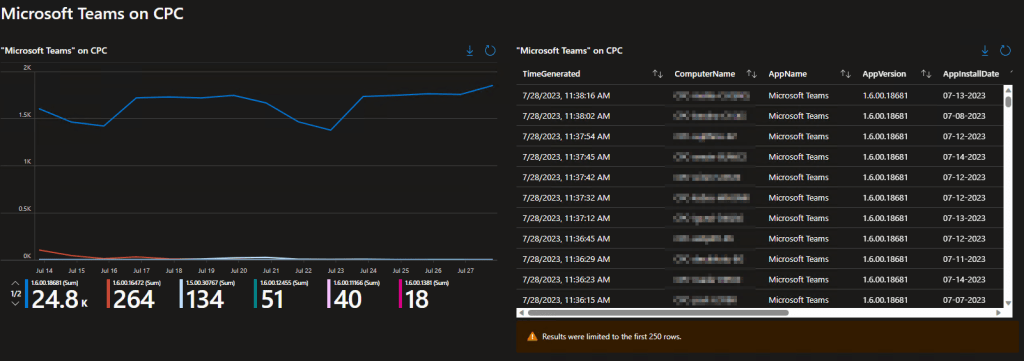
4: Teams on Windows 365 (Cloud PC)
Truth be told, to my knowledge the Cloud PC specific Teams isn’t really a thing anymore so this section might be redundant. Still, it lets you monitor Teams specifically as it exists on Cloud PC and includes update tracking day-to-day as well.
Patch My PC:
Full Disclosure: Log Analytics (and the devices themselves) have no idea what is and is not a Patch My PC managed app. However, it’s not that hard to build a query which results in a drop-down of just those apps. Since these apps run on their own auto-update system, it’s nice to see that it’s working as intended. This menu like before provides a pie chart for quick glances, a detailed exportable breakdown, and an over-time monitoring graph.
Note: This is a different kind of graph than before but shows the same update tracking data as before. What exact kind of graph is used (line, area chart, etc) can be easily changed to your preference.
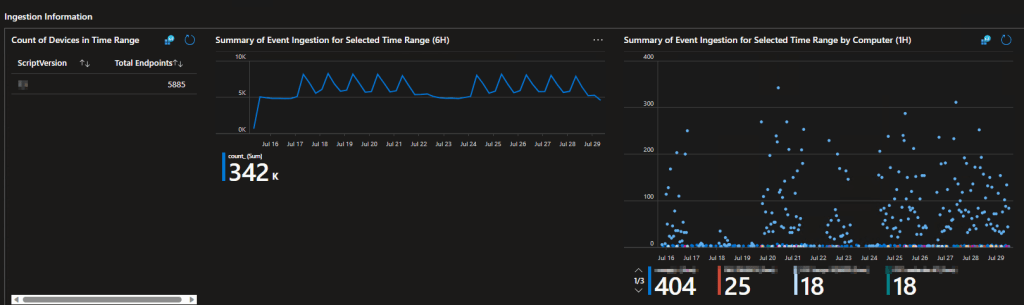
Ingestion Information:
This page is primarily intended for the admins running Log Analytics. It monitors how many data points are sending in data, what version of the script they are using to do so, how many data points come in per day, and what machines are sending the most data points. That last one is great for finding that one person who has 500 apps on their machine (seen it).
Technical Improvements – What is current?
This is going to get very technical but it’s very important.
The original version of this solution from the MSEndpointMGR team had, in my opinion, a major flaw.* It had no way to tell what was on a machine now, versus what had been but is no longer. It could only tell what a machine had reported at some point. Let me explain.
*Again, what I had was from June of 2022 or prior and they may have later changed this. See credit section of part one.
Previously, if a machine reported it had version 1 on the 10th, version 2 on the 11th, and version 3 on the 13th, the only results I could provide was that all three apps were, at some point, present. I couldn’t tell you what existed currently and was actually true, only infer it manually.
The smart folks out there are going to think “well, just do a distinct appname by the most recent time generated.” That works great until you remember some apps have the same name and multiple versions installed at once. You might then do distinct appname and version, but then that meses up the above scenario where we have an app updating.
Also, what if I remove an app? There is still a data point out there saying it existed. Either of the above will continue to report that data point until it falls out of the time range. We instead have to manually infer that app is gone because there are other data points of a newer date, yet its data point stopped updating.
We could narrow the data range to only points ingested in the past 24 hours to try and get more up to date and get around that problem, but this would ignore machines which have been off for the past few days.
You see why this is a problem?
So, it’s something I have worked to solve for a long time now. Without getting too into the weeds but wanting to save others from the roads I went down, I can tell you right now that using the most recent time generated by machine as a filter doesn’t work because large environments with tons of events coming in actually get slightly different time generated stamps on the same data-clump uploads from time to time (less than 5% but I want accurate data). Additionally, cramming the entire app inventory into a single line using arrays (you need 1 array per 50 apps due to character limits) is a god-awful nightmare which requires queries hundreds of lines long to work. It does work though, until you try to do a massive data pull. And it’s always very slow. And it creates single events of such a massive size some systems can’t handle it. Fun!
So, what’s the answer?
This is a concept I have been tinkering with in my free time and am now quite proud of. The time generated filter solution is actually very elegant, it just doesn’t work because that value can shift slightly in the middle of a data-clump. So, instead, I do individual events/lines per app and I place a value on every line of an upload that is a GUID – and we can find the GUID of the max timegenerated of a given machine to locate all, but only the most recent uploads, from that given machine. Thus, we have the true and accurate current status of that machine. This obviously works for multiple machines too. By doing the same action but binning by 1 day (finding the last GUID used each day), we can pull the status of a given machine or all machines for each day, just by what they had most recently at the end of that day. That’s how over time tracking works.
And this query is only a few lines long and is fast – at least compared to its 100+ long line cousin up above.
if anyone is curious, a single machine would have to repeat the same GUID within 30 days (or whatever you set Log Analytics to retain) for this to be a problem, which shouldn’t happen. It’s called a globally unique identifier for a reason.
Amazing, isn’t it?
Q&A:
Obviously, I am just now putting this out, so I don’t know what the FAQs are. I do however know one thing that comes up.
Q: Can I export a list of every app on every machine (with a per machine breakdown rather than just total count)?
A: Yes but no, depends, maybe.
You could absolutely write a query for this; it would be easy. The problem is, If I recall correctly, Log Analytics even on export tops out at 10,000 or maybe 100,000 lines. For a large org, you might exceed that limit in which case it just cuts off. There are ways around this though, such as sending the data off to another service which can do a larger export. See Event Hubs in the learning series. Running the query in Excel with a direct link to Log Analytics may also work.
Conclusion:
You should now have an idea of what this collector can give you, the value it provides, and the improvements that have been made. In the next part we will be looking at the Admin Inventory component to this puzzle.
The Next Steps:
See the index page for all new updates!
Log Analytics Index – Getting the Most Out of Azure (azuretothemax.net)
I will be putting the Windows Endpoint guides on the Log Analytics Index page under the Win365 series.
Disclaimer:
The following is the disclaimer that applies to all scripts, functions, one-liners, setup examples, documentation, etc. This disclaimer supersedes any disclaimer included in any script, function, one-liner, article, post, etc.
You running this script/function or following the setup example(s) means you will not blame the author(s) if this breaks your stuff. This script/function/setup-example is provided AS IS without warranty of any kind. Author(s) disclaim all implied warranties including, without limitation, any implied warranties of merchantability or of fitness for a particular purpose. The entire risk arising out of the use or performance of the sample scripts and documentation remains with you. In no event shall author(s) be held liable for any damages whatsoever (including, without limitation, damages for loss of business profits, business interruption, loss of business information, or other pecuniary loss) arising out of the use of or inability to use the script or documentation. Neither this script/function/example/documentation, nor any part of it other than those parts that are explicitly copied from others, may be republished without author(s) express written permission. Author(s) retain the right to alter this disclaimer at any time.
It is entirely up to you and/or your business to understand and evaluate the full direct and indirect consequences of using one of these examples or following this documentation.
The latest version of this disclaimer can be found at: https://azuretothemax.net/disclaimer/
