This will be the last part of this guide. Here we will be deploying and modifying the workbook to match your environment as well as going over the deployment of the collectors and some of the options within them to configure how they function.
Note: If you followed the V1 version of this series, you do NOT need to redeploy the Workbook. in the last section, you should have granted the new Function App permissions to the existing DCRs. That puts data into the same tables, and thus into the existing workbook. No changes were made to the workbook for the V2 of the Win365 series.
In this section we will cover…
- Editing the Workbook Region Query
- Editing the Workbook Region Dropdown
- Importing the .Workbook File
- Collector Options
- Deploying the Collection Scripts
- Conclusion
1: Editing the Workbook Region Query
Much like the last part, we have another chicken and egg situation. What we need to do is import the Workbook, which is easy, but we also need to edit it. While you can do that in Log Analytics, in this specific situation it’s a lot easier to edit it manually in my opinion.
Head back to the GitHub and grab the Windows 365 MonitoringV2.workbook file. This is actually a JSON formatted file, .Workbook is just how Log Analytics exports it.
Open this file up in your favorite text editor, for this procedure I highly recommend something with a replace (or replace all) function like Visual Studio Code or NotePad++.
21 times throughout the workbook you will find this piece of text…
extend \r\n region = iff(NetworkAdapters has \"10.1\", \"US-East\", (iff(NetworkAdapters has \"10.2\", \"India\", \"Japan\")))\r\n
This is the code used in (almost) every query to determine what region a device is in and thus allow filtering and displaying of that data by only specific regions. This is why there is a requirement that your different regions have a different IP schema. What this query says is that iff the network adapters field as a whole has a 10.1, that’s a US-East device. For the else statement of that Iff statement we nest another Iff statement that says if it has 10.2, that’s an India device. For the else statement of that nested iff, we say if it’s not one of those two prior things, it must be a Japan device.
You need to alter this KQL query with your regions and then replace all instances of the above with your version. Obviously, this format is not the friendliest version to edit it in and it’s hard to tell if it’s worked or not. For that reason, here is what I recommend.
Head to your Log Analytics Workspace, change to the Logs view, and use this query.
Windows365Events_CL
| where ComputerName has "CPC-"
| where EventType == "RDP-Disconnect"
| extend
    region = iff(NetworkAdapters has "10.1", "US-East", (iff(NetworkAdapters has "10.2", "India", "Japan")))
| project TimeOfLogUTC, ComputerName, region, EventType, User, Message
| sort by todatetime(TimeOfLogUTC)
What we will then do is alter that query to work for your region setup. Obviously, you will need data from devices in a few regions to know for sure if it’s working or not. The structure of an iff in KQL is iff(Field Operator “thing to look for”, “yes results”, “else result”) – so we will continue deepening the various else results as needed with more comparisons.
Note: The total amount of iff statements needed is going to be the total number of regions minus one.
For instance, the below will require four total iff statements. Four Iffs for the first four, and the last region can be the else of the last iff statement.
- US-East 10.1
- US-Central 10.5
- Germany – 10.7
- Australia – 10.8
- Antartica – 10.9
The region names are case sensitive and referenced later!
How you type them here is how it will appear in the query results!
And here is what that would look like. Be careful with your parathesis, there should be two sets per every inner iff statement but only one set on the initial.
Windows365Events_CL
| where ComputerName has "CPC-"
| where EventType == "RDP-Disconnect"
| extend
    region = iff(NetworkAdapters has "10.1", "US-East", (iff(NetworkAdapters has "10.5", "US-Central", (iff(NetworkAdapters has "10.7", "Germany", (iff(NetworkAdapters has "10.8", "Australia", "Antartica")))))))
| project TimeOfLogUTC, ComputerName, region, EventType, User, Message
| sort by todatetime(TimeOfLogUTC)
You can then copy paste the “region” clear to closing final parathesis right into and over the earlier JSON portion. For instance…
extend \r\n region = iff(NetworkAdapters has "10.1", "US-East", (iff(NetworkAdapters has "10.5", "US-Central", (iff(NetworkAdapters has "10.7", "Germany", (iff(NetworkAdapters has "10.8", "Australia", "Antartica")))))))\r\n
And finally, you need to modify each “text” to the format \”text\” (first slash is OUTSIDE the quotes).
extend \r\n region = iff(NetworkAdapters has \"10.1\", \"US-East\", (iff(NetworkAdapters has \"10.5\", \"US-Central\", (iff(NetworkAdapters has \"10.7\", \"Germany\", (iff(NetworkAdapters has \"10.8\", \"Australia\", \"Antartica\")))))))\r\n
What you then need to do is locate and replace every instance of the original query line with your new altered line and save the .workbook file. Again, I really recommend just using a find all and replace function like what Notepad++ or VSC has.
2: Editing the Workbook Region Dropdown
We are almost done with the editing, just one more luckily easier item to go.
Near the top (relatively) you should be able to CTRL+F and locate this. There should only be one instance of this.
[\r\n \"US-East\",\r\n \"India\",\r\n \"Japan\"\r\n]
This is the brief JSON data that controls what regions are offered in the region drop down at the top of the workbook that then tells all the queries how to filter the result of the region information we just taught it. We need to alter this to match the region names we just punched in. This is case sensitive and needs to match the queries we just made!
Here is what my example would then look like.
[\r\n \"US-East\",\r\n \"US-Central\",\r\n \"Germany\",\r\n \"Australia\",\r\n \"Antartica\"\r\n]
Once you have modified yours, just replace the section and again save the workbook file.
3: Importing the .Workbook File
We are now finally ready to head out to Log Analytics and upload the Workbook file!
You will need to go to Workbooks on the left, and then choose the Empty option.

Then, look for the </> icon along the top and click it.

This will open the JSON view for the workbook. You need to CTR+A and simply delete the default content present. Then, copy paste in the full content of your now modified .Workbook file. As long as all your edits were properly done, you should not see any red markers or any errors on the scrollbar / top. You may notice a single yellow dot on the scrollbar on the right, that is fine. Finally, hit the Apply button.

This should kick you out to the main page of the workbook. Here you can open the Region(s) dropdown and you should see that your edits are present. You may notice that some/all regions are not selected by default. This is okay and I will touch on this later.

You can now enable and disable regions, change the various drop-down selections, browse through the tabs, and view data as much as you want.
Once you are comfortable things are working as they should (queries are showing data), we need to set the default workbook state. This means setting ALL dropdown options to how you would want them to be set whenever you (or anyone) first open the workbook. To be clear, you will be able to alter these dropdown selections while in the workbook even via non-editing mode but, whatever they were set to when someone last saved the workbook is the default options the workbook will go to whenever you (or anyone) first open it, or back out of it and go back in.
So, we need to set all the dropdowns to a default state you like. All of the drop downs have an information bubble on their right edge which will tell you what they do. I can tell you that for the cost you per GB you need to refer to here. Set your region and look for your plan under Analytics logs pricing.
Under the Cost Prediction tab you will find a Total Endpoints and Time Range Numerical value. Don’t touch these!!!! If you manually enter something, you will break the query that dynamically calculates them. Why you can even manually set a field that is controlled by a query is beyond me. If you do mess them up, the simplest answer is to reload the whole workbook from the saved file you have. There is a way to put the queries back in place but that would require a separate part it’s such a pain.
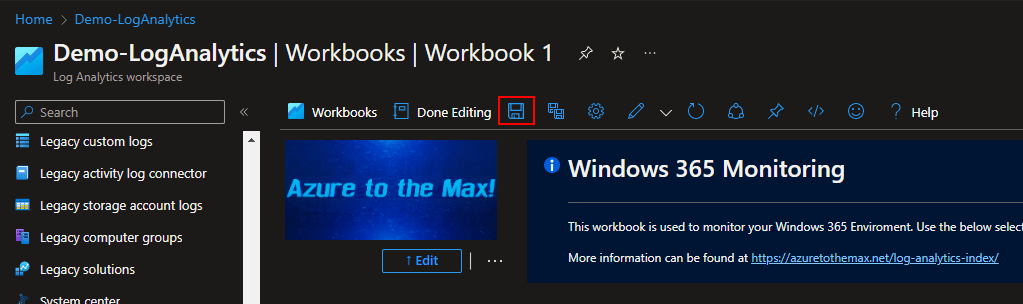
Once everything is set to a default state you are okay with, look for the save icon (floppy disk) at the top. You will be prompted to name the workbook as part of saving it.
Once you hit Apply on the save menu, your workbook will think for a moment and then the new name will take the place of Workbook 1 at the top. You can then back out to the workbooks view and (after a few minutes) your new workbook will appear in the workbooks view. This caching is weird, it may not show up right away, give it time.
For all questions regarding what the queries show, how to use them, etc, please see the content of the workbook as there is no shortage of explanation as to what each one does and how to adjust the drop downs.
4: Collector Options
There is one last item we need to cover before we actually deploy this thing to some devices. Let’s talk about those controllable parameters in each script a little. Truth be told, I wrote painful amounts of comments in the scripts themselves and they can tell you even more than I will cover here as there are some variables you shouldn’t really ever change. This will just be a discussion about what you can and/or may want to change.
Common Items:
$AzureFunctionURL – This is again the URL to your Azure Function and should already be filled in.
$DcrImmutableId – this is again the ID of your DCRs and should already be filled in.
The below section makes sure that when the script runs, it only collects data from devices which have a name that has CPC- in it somewhere and thus makes sure that if you scope to non-cloud PC’s, data won’t be collected. The queries themselves also have a measure to make sure the device name has CPC- in it too. If for some reason Microsoft ever alters the CPC- naming scheme, this will need to be adjusted to compensate.
if ($ENV:COMPUTERNAME -like "*CPC-*"){
    $CollectAppInventory = $true
} else {
    $CollectAppInventory  = $false
    Write-Host "Not a Cloud PC"
    exit 0
}
$AppLogName – You can alter this if you want, it’s the friendly name and controls the name of the files created by the $WriteLogFile value. More information about what this does can be found on this blog here.
$WriteLogFile – As we saw before, turning this on causes local files to be spat out for validation and use as sample data. Obviously, turn this off when deploying it. The event collector has some more complicated controls behind this I will cover in a moment.
$Delay – This controls the random 50-minute delay for uploads to help save money. More info here. See the header “What is $Delay?” This should be set to $True for deployments.
Windows 365 Event Collector:
This script has a few of it’s own controls the app collector does not.
$InitalCollectionDays – This is how many day’s worth of data back it will pull on the very first run. First run is determined by a lack of a time marker file in C:\Windows\LogAnalytics.
$MaxCollectionInterval – This value in milliseconds is how much maximum amount of time worth of events you want to collect. For example – If somehow a device was running the collector, stopped uploading data for 6 months, and came back to life, you probably don’t need/want all six months of data to be ingested. If the calculated difference to collect is greater than this value, this value is instead used. Don’t set an initial collection period greater than your max interval. Again, this math is done using the marker file in C:\Windows\LogAnalytics. There are plenty of comments in the script if you want to know how this works.
$AlwaysReportStartup – This is a fun one. I have mentioned several times that the startup time is not based on an actual event. This is because any device with a 30+ day uptime would simply fall out of that chart since data points are only held onto for 30 days. So, I made it calculate it instead. By default, this value is false which means a startup event is only uploaded when there is also a TCP/UDP or disconnect event to upload. This saves money as otherwise you would pay to ingest that bit of data each time the script is ran. However, a device that goes unused for 30 days may still fall off the report as it won’t have any RDP disconnect or TCP/UDP events to upload. If you are okay with the extra cost, you can set this to $true such that each time the script runs it will always upload startup data regardless of having other events to upload or not.
$ScanBackValue – This controls how much times worth of data to pull when generating sample data as controlled by $writelogfile. By default, it pulls 7 days. Again, this is only for sample data creation.
5: Deploying the Collection Scripts
Make sure to set $WriteLogFile to $False as well as changing $Delay back to $True before deployment!
Last but not least, how do you deploy the collector?
This is actually rather one-for-one to the learning guide. As such, please refer to the learning serries for information on how to actually deploy one of these collectors via Proactive Remediations. That can be found here: PowerShell DCR Log Analytics: Part 2.7 – Deploying Data Collection Scripts – Getting the Most Out of Azure (azuretothemax.net)
However, there is something I want to add to this regarding the scheduling. As I mentioned in the section “A Tangent on Cost and Run Frequency” of the above linked article, there is a difference between collecting Windows Events and simple static data as far as how to schedule that collection.
The app collector is rather static data in the sense that each time you run it you collect the same (and all) data points. For that reason, I would run it only every 4 or even 6 hours at most. That means your data will be 4-6 hours plus up to 50 more minutes delayed from “live.” If you want to run it hourly such that you have only up to 110 minutes of delay (one hour plus up to 50 random minutes due to $delay) you can however, that costs very linearly 4-6x time as much as collecting it only every 4-6 hours. Because again, you are paying to ingest the same full data 4-6 times as often. To be clear, that’s only ingestion cost we are talking about here, running it more often does affect Function App cost too.
However, the event collector only collects Windows Events and uploads them as they are created. For that reason, it makes no cost difference (ingestion wise) how often you run it. You can run it every hour or every 12 hours and either way it will only upload the events generated since it last ran. For that reason, I suggest running it hourly that way your data is as live as possible. Especially since these events are more closely tied to outage events. That said, if you change $AlwaysReportStartup to true and run this hourly, you will then be paying to ingest that same data point every hour regardless of whether it’s changed or not.
Obviously, you should scope to small test groups to start out with. Get a few devices from each region if you can. Try your best to avoid scoping to non-Cloud PC’s. That can be controlled via dynamic groups or filters. And, as discussed here and explained in the workbook itself, you can scope to say 1% and then 10% of the company and use the cost monitoring and prediction tabs within the workbook to check scale up cost. Again, that’s only ingestion cost. Never ever use less than 7 days’ worth of steady data for a cost prediction. Steady meaning you scoped to X audience and left it only with that audience the entire time. For example, don’t run a prediction using 7 days of data 3 days after scoping to an additional X% of devices.
Conclusion:
You should now be armed with everything you need to know to go forth and conquer! Good luck and happy logging!
The Next Steps:
See the index page for all new updates on Log Analytics. That said, this is the end of the Windows 365 monitoring topic, at least for now.
Log Analytics Index – Getting the Most Out of Azure (azuretothemax.net)
Disclaimer
The following is the disclaimer that applies to all scripts, functions, one-liners, setup examples, documentation, etc. This disclaimer supersedes any disclaimer included in any script, function, one-liner, article, post, etc.
You running this script/function or following the setup example(s) means you will not blame the author(s) if this breaks your stuff. This script/function/setup-example is provided AS IS without warranty of any kind. Author(s) disclaim all implied warranties including, without limitation, any implied warranties of merchantability or of fitness for a particular purpose. The entire risk arising out of the use or performance of the sample scripts and documentation remains with you. In no event shall author(s) be held liable for any damages whatsoever (including, without limitation, damages for loss of business profits, business interruption, loss of business information, or other pecuniary loss) arising out of the use of or inability to use the script or documentation. Neither this script/function/example/documentation, nor any part of it other than those parts that are explicitly copied from others, may be republished without author(s) express written permission. Author(s) retain the right to alter this disclaimer at any time.
It is entirely up to you and/or your business to understand and evaluate the full direct and indirect consequences of using one of these examples or following this documentation.
The latest version of this disclaimer can be found at: https://azuretothemax.net/disclaimer/
