While I did do a section on cost mainly from an initial prediction standpoint, this section will cover how you can monitor cost going forward once things are setup. I can also guide you in cost prediction to scale the solution up.
Unfortunately, this process is a little tricky and I almost considered not writing this part for that reason. It’s once again a situation where it’s much easier to show you what we can do and then explain the downfalls and shortcomings.
In this section we will cover…
- How to View Total Resource Cost
- How to View Total Ingestion Cost
- The Problem
- The solution
- How to Get Custom Table Ingestion Information
- Conclusion
How to View Total Resource Cost:
- Head to the Azure Home
- Use the search at the top to locate Cost Analytics (Preview).
Obviously, one day this will come out of preview and change names.
This should open up to the Cost Analysis (Preview) (1) menu and a new tab.
- You will need to set the scope (2) for your Subscription and Resource Group at the top. Choose the Resource Group housing your Log Analytics components.
- Then, choose Resources (3)
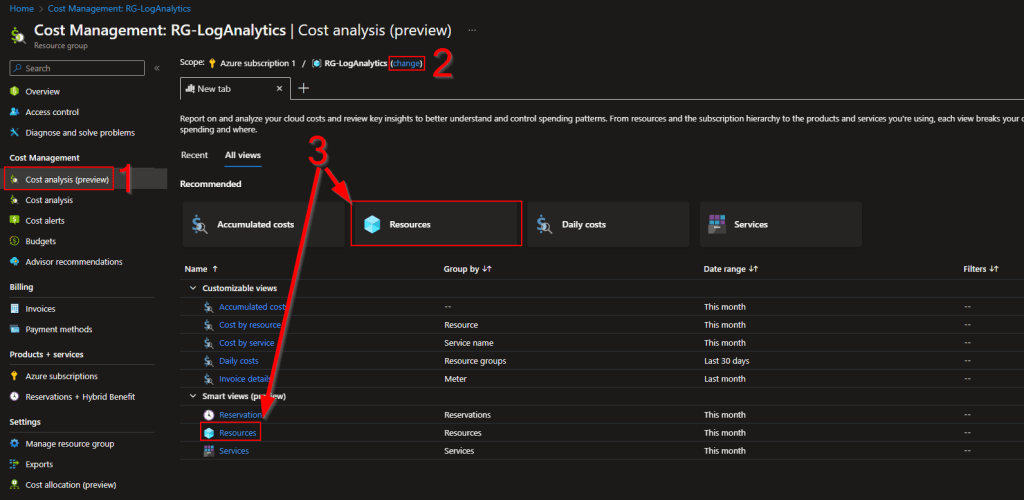
This should take you to a menu like this.
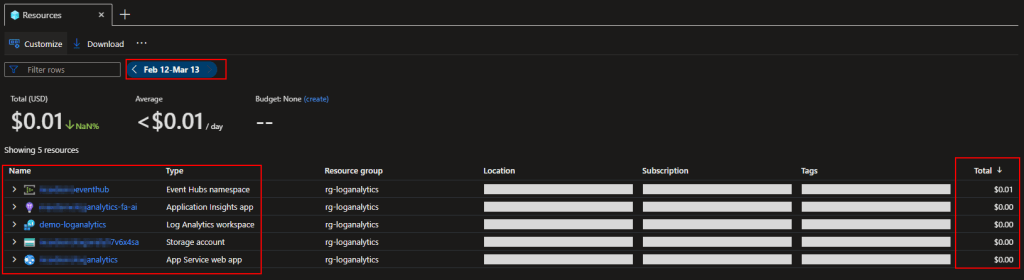
You can use the date adjuster at the top to control the range of data displayed. Below you will see the individual resources listed out and their sum price for that range. Here is what you would see in reference to this guide.
- Event Hubs Namepsace – This is the cost of ALL Event Hubs in that Namespace.
- FA-AI – This is the Function Apps Application Insights. You can temporarily disable this to save money!
Saving a Buck by Temporarily Disabling Application Insights – Getting the Most Out of Azure (azuretothemax.net) - Log Analytics Workspace – This is the cost of ALL tables/queries/etc within that Workspace.
- Storage Account – This is the storage account used by the Function App
- App Service Web App – This is the Function App itself, as far as cost goes anyways.
How to View Total Ingestion Cost:
There is also a way to see total table ingestion cost into Log Analytics separately. You can head into your Log Analytics Workspace and go to Usage and Estimated Costs to see a current GB and monthly prediction based on the past 30 days. Again, this is ALL your tables put together.

While Microsoft does provide workbooks for cost monitoring by default, if you try to use any of their prebuild Workbooks, they probably won’t display any data at all. While these are designed to show cost per table, they aren’t designed to work with Custom Tables and instead only show the default tables which you likely are not using. And that brings us to…
The Problem:
If someone asks, “How much is the total cost of this thing for the past month?” – the above two sections can provide you with answers.
However, if someone asks, “How much are the individual table ingestion costs?”, you can’t see that with the built in tools. You also can’t answer how much it’s going to cost to scale X table out to the organization because of this.
The solution:
The one answer I can provide is for table scalability. You can often do a very linear and yet still accurate prediction on ingestion cost. For instance, if you have been running a collector on 100 devices for 7 days (the bare minimum days you should ever use for a pricing prediction) and want to know the prediction to have that sent to 10,000 devices, it’s very simple math.
You just need to know how many GB your 100 devices have brought in during that week, scale that up to 10,000 devices, scale that up to a month, and multiply by $2.30. That would be the total cost prediction for a month with 10,000 devices.
I have typically deployed to 1% of an org, checked the math to make sure it was okay, deployed to 10%, checked the math again, then sent out to 100%. So far, I have found the difference between the 1% and 10% predictions to be very little, and both of them to be very accurate to what 100% will cost. While I almost always find some glitched device that’s very noisy, one very noisy device really doesn’t disturb the grand total much.
How to Get Custom Table Ingestion Information:
However, this begs the question of how do you actually get the individual count of GBs ingested into a single custom table.
Shocker, there is a query for that. Drop in your table name and crank the query writer up to 7 days and ta-da! You have a MB count for the past 7 days of X table. Again, NEVER run a cost prediction on less than 7 days’ worth of data.
The usage table can be slow to update though so if you are in a small test tenant just following along, this might not return any data. I had to wait hours for it to show a value of a whopping 0.001 since it’s just my test data.
Usage
| project TimeGenerated, DataType, Solution, Quantity
| where DataType in ('SampleCollection_CL')
| summarize IngestionVolumeMB=sum(Quantity) by DataType
| sort by IngestionVolumeMB
| project DataType, IngestionVolumeMB
Now you might think, gee, wouldn’t it be great if there was a query that could dynamically have a table selected, calculate how many devices there are based on the count of unique names that have come in, know what time range you are looking at, and automatically calculate that up to a month and a given device count?
Yes, and I have just that. However, it’s built specifically for certain tables and there is no point in me making one for the sample collector since I doubt anyone will deploy it in large scale. Instead, that information is going to come as part of the collector and workbooks I will be releasing in the future. So, if you need that sort of information, look for blogs in the future. I already know this will be part of the Windows 365 collection script and workbook.
Conclusion:
You should now have some knowledge on how to monitor your cost, as well as an idea of how to calculate cost predictions based on data you are already gathering.
The Next Steps:
I believe this is the end of our journey, at least for now. However, you can always find the other parts to this guide (or any new parts I release) at the below. Again, more Log Analytics blogs are definitely going to follow, they just won’t be additional generic educational pieces like these have been.
Log Analytics Index – Getting the Most Out of Azure (azuretothemax.net)
Disclaimer
The following is the disclaimer that applies to all scripts, functions, one-liners, setup examples, documentation, etc. This disclaimer supersedes any disclaimer included in any script, function, one-liner, article, post, etc.
You running this script/function or following the setup example(s) means you will not blame the author(s) if this breaks your stuff. This script/function/setup-example is provided AS IS without warranty of any kind. Author(s) disclaim all implied warranties including, without limitation, any implied warranties of merchantability or of fitness for a particular purpose. The entire risk arising out of the use or performance of the sample scripts and documentation remains with you. In no event shall author(s) be held liable for any damages whatsoever (including, without limitation, damages for loss of business profits, business interruption, loss of business information, or other pecuniary loss) arising out of the use of or inability to use the script or documentation. Neither this script/function/example/documentation, nor any part of it other than those parts that are explicitly copied from others, may be republished without author(s) express written permission. Author(s) retain the right to alter this disclaimer at any time.
It is entirely up to you and/or your business to understand and evaluate the full direct and indirect consequences of using one of these examples or following this documentation.
The latest version of this disclaimer can be found at: https://azuretothemax.net/disclaimer/
