The last several parts of this series have been rather large so, I am going to keep this one nice and short. This will cover only the deployment of the script via Proactive Remediations as well as some simple queries to watch as new devices check in. Discussion regarding how the script works and how to modify it (along with the Table and DCR) are being pushed to the next part.
This will also discuss some pricing concerns regarding scheduling of the scripts and how frequently you run them.
In this section we will cover…
- What are Proactive Remediations?
- Preparing the Sample Collection Script
- What is $Delay?
- Update: Menu Names and Licensing Validation
- A Tangent on Cost and Run Frequency
- Back to the Deployment
- Conclusion
What are Intune Proactive Remediations?
If you are not familiar with Intune Proactive Remediations, this is how we will send our PowerShell collection script to client devices with a reoccurring interval. PR (Proactive Remediations) is effectively modern enterprise-level Task Scheduler but does have licensing requirements. If needed, you can technically use a different means to execute the scripts so long as you can run it as System and on a suitable interval.
For this example, we will be deploying the script to run on all devices every four hours.
Preparing the Sample Collection Script:
If you are following the guide, you should still be using SampleCollectionScriptV3.ps1. Last time we mentioned some variables that need set in the script. You should still have all of the following set.
- $AzureFunctionURL – This is the URL/URI to call your Function.
- $Table – The full name (including _CL) of the table.
- $DcrImmutableId – The Immutable ID you collected from the DCR JSON.
- $WriteLogFile – This should have already been set back to the default of $False when you did your first test ingestion.
- $LogName – This value actually doesn’t matter. Consider it a friendly log name that gets logged in the Function App as well as when using WriteLogFile.
What is $Delay?
However, we need to talk about $Delay again. For the prior initial ingestion test this would have been set to $False. To deploy this, $Delay should be set to $True. What this variable does is inject a random delay of up to 50 minutes on the upload. The purpose of this is to help spread out calls to the Function app over time.
This information and bit of code is regurgitation from the MSEndpointMGR team’s original HTTP API Function App used in the Intune Enhanced Inventory project.
The problem is that if you set something to go, for example, every hour, all the devices will try to run it at or typically shortly after the top of the hour. With a self-scaling consumption plan and say 5,000 devices, this can become rather expensive as the Function suddenly scales up a high number of instances and memory to try and handle the flood of simultaneous requests.
By slowing it down over the course of an hour, you save money as the Function won’t be so easily overwhelmed.
That said, if you are thinking you can get around this by running it every few hours, it won’t work. In my experience, telling it to run say every four hours doesn’t cause machines to run on individual (and thus staggered) four-hour offsets. What I have seen in that machines instead go at midnight, 4 AM, 8 AM, 12 PM, etc – all on UTC. So, all machines will still try and run at roughly the same time. I wasn’t able to find a concrete confirmation of this from Microsoft though.
Update: Menu Names, Locations, and Licensing Validation
Notice for the red headers below: These next two headers have sections tagged with “Old” as well as “(You can now jump to the next header)” – keep an eye out for these. The old information is just that, the old versions of these menus which I keep around as a sanity check that they really do just keep changing over and over. The newest information is always just under the header, and the end of it is followed by the previously mentioned note so you know you are ready to move on to the next header.
Update to Menu Location Q1 2024:
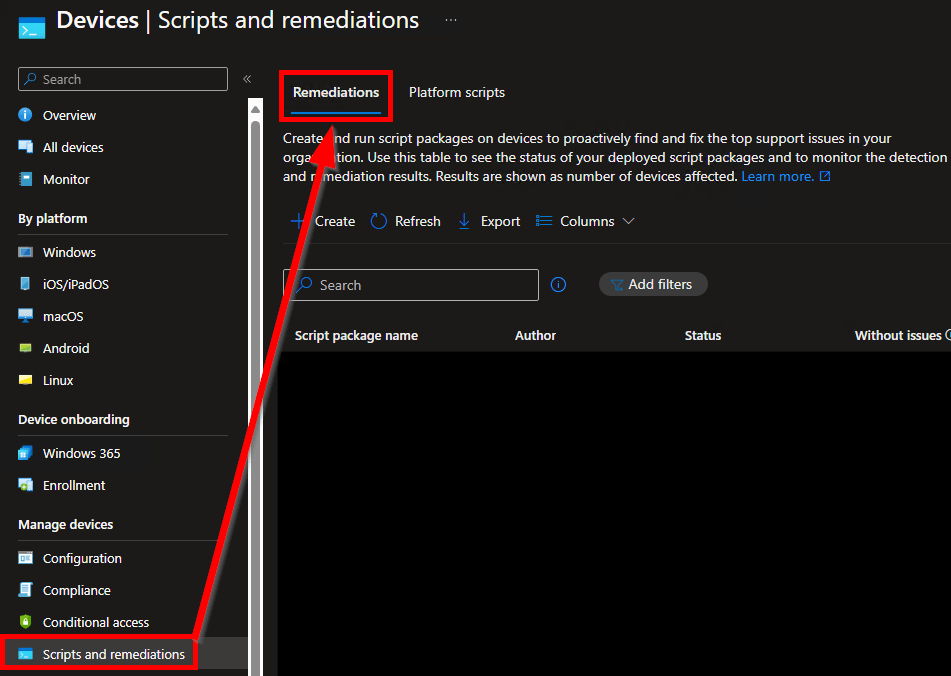
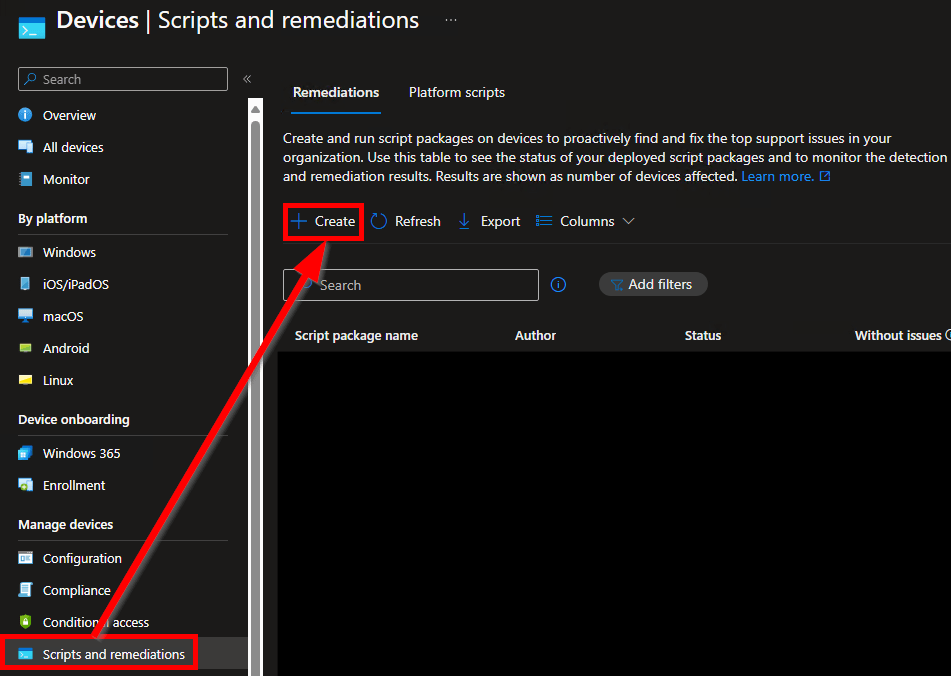
As of roughly Q1 2024, Microsoft has once again moved the Proactive Remediations menu (now simply called Remediations) to Devices, Scripts and Remediations. There is now a selector at the top of the page to toggle between Remediations and Platform Scripts (previously known as just Scripts).
(You can now jump to the next header)
OLD circa mid-2023:
Microsoft has moved the remediations menu again… I like where it is now, it makes a lot more sense, but can we PLEASE leave it alone for more than 3 weeks?? It makes maintaining this page a PITA.
It can now be found inside the Devices menu right under scripts, which makes a lot more sense than being buried in reports. It has been renamed to simply Remediations.

OLD-er: Microsoft can’t seem to stop altering the overview menu for Proactive remediations. Back in March they renamed the “Proactive Remediations” menu to simply “Remediations.” So the new path to the menu became Reports, Endpoint Analytics, Remediations. The menu name change was undone quickly. (Although as of July it’s now re-done but the menu was also moved!)
Update to Licensing Confirmation July 2023:
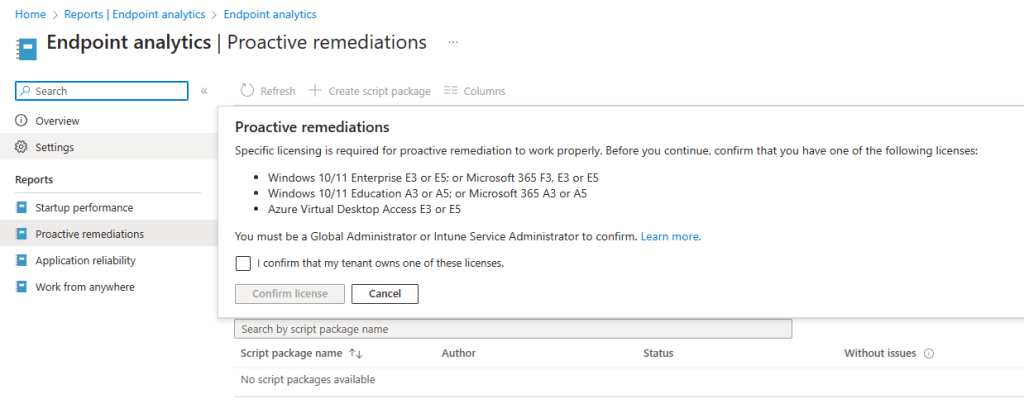
This has also gone through a change although, it might just be showing me this because I have seen the popup before but, it appears the popup is gone entirely and replaced with these instructions to confirm your licensing status.
Enable use of Windows diagnostic data by Intune – Microsoft Intune | Microsoft Learn
(You can now jump to the next header)
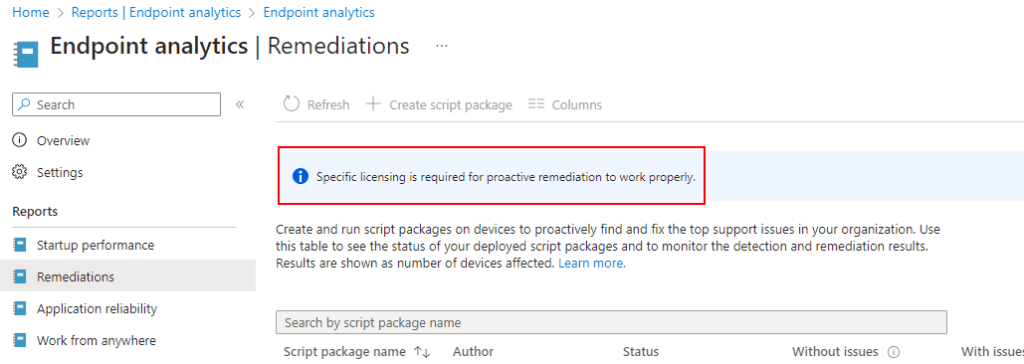
OLD: This popup has been changed again, for now at least it looks like this.
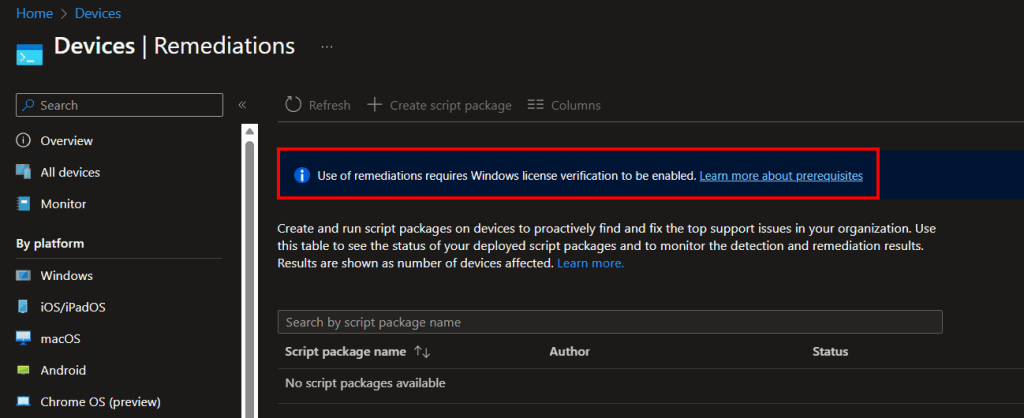
OLD-er: Now when first accessing the licensing page you will be met with an information box and the create option is greyed out. Simply click the information box…
Expand the Windows License Verification, verify you meet the requirements, flip the flipper to on, and hit save at the top.
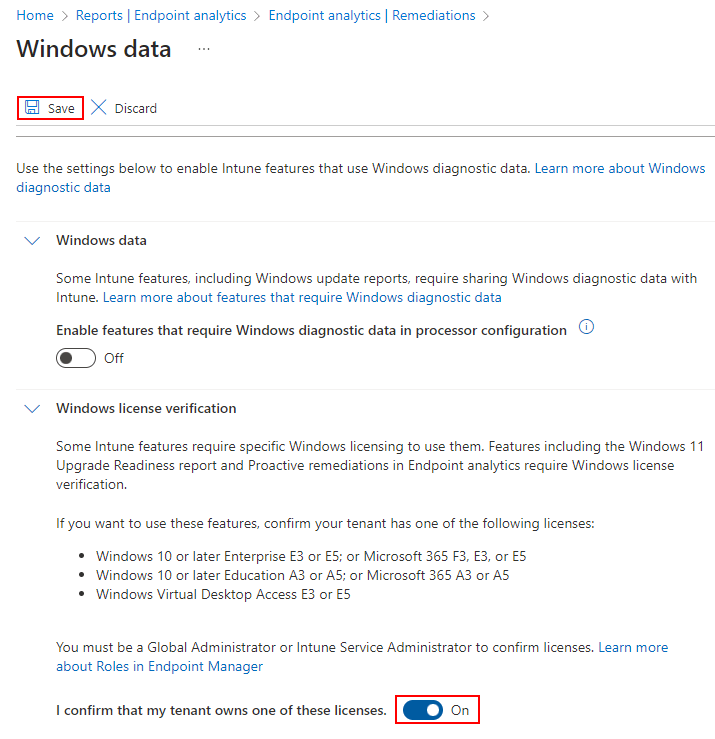
This menu will then vanish, I actually couldn’t figure out how to get back to it. But regardless, you can now create Proactive Remediations. They do seem to still require the devices actually be enterprise activated though.
Pushing the Sample Script via Proactive Remediations:
If you have never used it, this menu is in a very strange location.
- Head into Intune
- Again, as of roughly Q1 2024, the menu is now located under Devices, Scripts and Remediations – see prior section for more details.

- Choose Create while under the Remediations tab (See above and below image).
Note: You may need to confirm your tenant licensing if the option is greyed out like. See prior section for details.
- You will need to give the script a Name and Description. These are just friendly values.
You will then be prompted for a multitude of values. These are the only ones you need to set / change.
- Detection Script File.
This is the data collection script, just browse out to wherever you have saved it. - Run Script in 64-Bit PowerShell
Change this to yes. Without it, you can’t query 64-bit registry locations properly.
We don’t need a remediation script for this, nor do we want to run as user (we want to run as System). Script Signature Check is something you will have to look into on your own and make your own determination.
When the information has been entered, hit Next.

Filling in any Scope Tags are up to you, if you use them. When done, hit Next.
For groups, you need to select either a user group or device group. Know that if you select a user group, it runs on any device that user logs into, not devices they own and not devices they aren’t logged into actively.
Additionally, if you scope to a user/device group, you can (or should) only exclude a matching group. Don’t scope to devices and try to exclude users.
Given these are data collection scripts, I would highly recommend scoping to DEVICES as we need these scripts to run regardless of a logged in users presence. I would also recommend you to use a small test group if this is your first time.
You can deploy to all devices using the upper drop-down Selected Groups box or pick individual groups using the Select Groups to Include hyperlink.
All Devices:
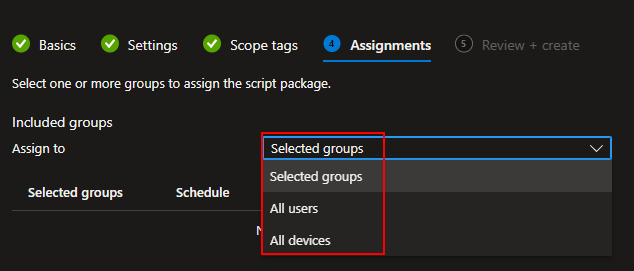
Selected Groups:

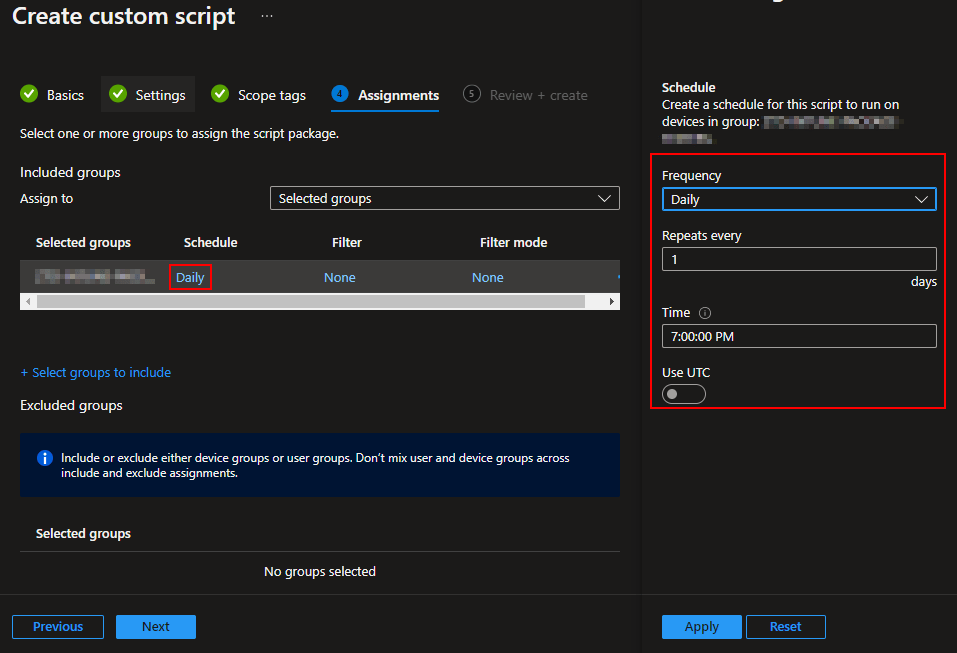
Once a group is selected, you can then alter the schedule for that group. You can put different groups on difference schedules.
A Tangent on Cost and Run Frequency:
It’s very important to understand that there IS a direct relationship between the run frequency of your proactive remediation script and cost – sometimes.
Windows Events:
For collector scripts that collect something generated over time like Windows Events, I would likely run it hourly since the data collector will only ever upload new events. If there aren’t any new events to upload when it runs, nothing is uploaded and there is no cost (no charge to simply kick it off via PR). So, under these circumstances, there is no harm/cost change in running it as much as you want and honestly, unless you really don’t ever plan to need this data quickly, you probably should.
Large mainly static data:
For collector scripts collecting large query-based data (such as all software on a machine), I might run it every four or six hours at most. This is because, for something like all application inventory, I am effectively paying to ingest the same KB of data each time the PR runs, regardless of if there was a change. So, for example, the same “all app inventory” script ran only once a day cost effectively 1/24th as much as running it every hour. In other words, the more often you run a query-based collection, the more it will cost as you pay to ingest X data each time you run it. When it comes to this sort of data, you have to make a call between how up to date the data is, and how much you are willing to pay for it being up to date.
Since this sample data is query based (same fields and values report in each time) and not time sensitive at all, I am going to go with once a day.
Back to the Deployment:
Once you have your groups and schedules figured out, you can go ahead and hit Next and Create.
Now, you can watch your Logs view and use these queries to see how many devices have checked in or see what devices have checked in and when.
Count of distinct clients reporting in:
SampleCollection_CL
| distinct ComputerName
| summarize Client_Count=count()
List of what machines have checked in and when:
SampleCollection_CL
| project ComputerName, TimeGenerated
If you want to get fancy, you can graph how many devices have checked in each hour over time like this.
SampleCollection_CL
| distinct TimeGenerated,ComputerName
| summarize count() by bin(TimeGenerated,1h)
| render timechart
That said, I have found that the deployment of Proactive Remediations are PAINFULLY slow. Even if you tell it to run hourly and scope to thousands of devices, I would expect only 10% of your scoped population to have checked in within 3 hours.
So, if you scoped to 30 devices on an hourly schedule, 3 hours later you might have 3 new devices in the log. If you scoped to 10,000 devices on an hourly schedule, 3 hours later you might have only 1,000 devices.
Conclusion:
Given some time, you should have some test devices now checking into your log. Next, we will dive more into how the script works and how to modify it with some more powerful data fields, along with do some simple queries with that data.
The Next Steps:
See the index page for all new updates!
Log Analytics Index – Getting the Most Out of Azure (azuretothemax.net)
Disclaimer:
The following is the disclaimer that applies to all scripts, functions, one-liners, setup examples, documentation, etc. This disclaimer supersedes any disclaimer included in any script, function, one-liner, article, post, etc.
You running this script/function or following the setup example(s) means you will not blame the author(s) if this breaks your stuff. This script/function/setup-example is provided AS IS without warranty of any kind. Author(s) disclaim all implied warranties including, without limitation, any implied warranties of merchantability or of fitness for a particular purpose. The entire risk arising out of the use or performance of the sample scripts and documentation remains with you. In no event shall author(s) be held liable for any damages whatsoever (including, without limitation, damages for loss of business profits, business interruption, loss of business information, or other pecuniary loss) arising out of the use of or inability to use the script or documentation. Neither this script/function/example/documentation, nor any part of it other than those parts that are explicitly copied from others, may be republished without author(s) express written permission. Author(s) retain the right to alter this disclaimer at any time.
It is entirely up to you and/or your business to understand and evaluate the full direct and indirect consequences of using one of these examples or following this documentation.
The latest version of this disclaimer can be found at: https://azuretothemax.net/disclaimer/
